
Strategy Builder & Optimizer (for your Ideas!)
https://www.tradingview.com/v/Z23LASa3/

All-in-one trading strategy builder & optimizer. Designed for all traders. This indicator helps traders of any skill level execute backtests and test up to 1000 different profit targets and stop losses for their strategy.
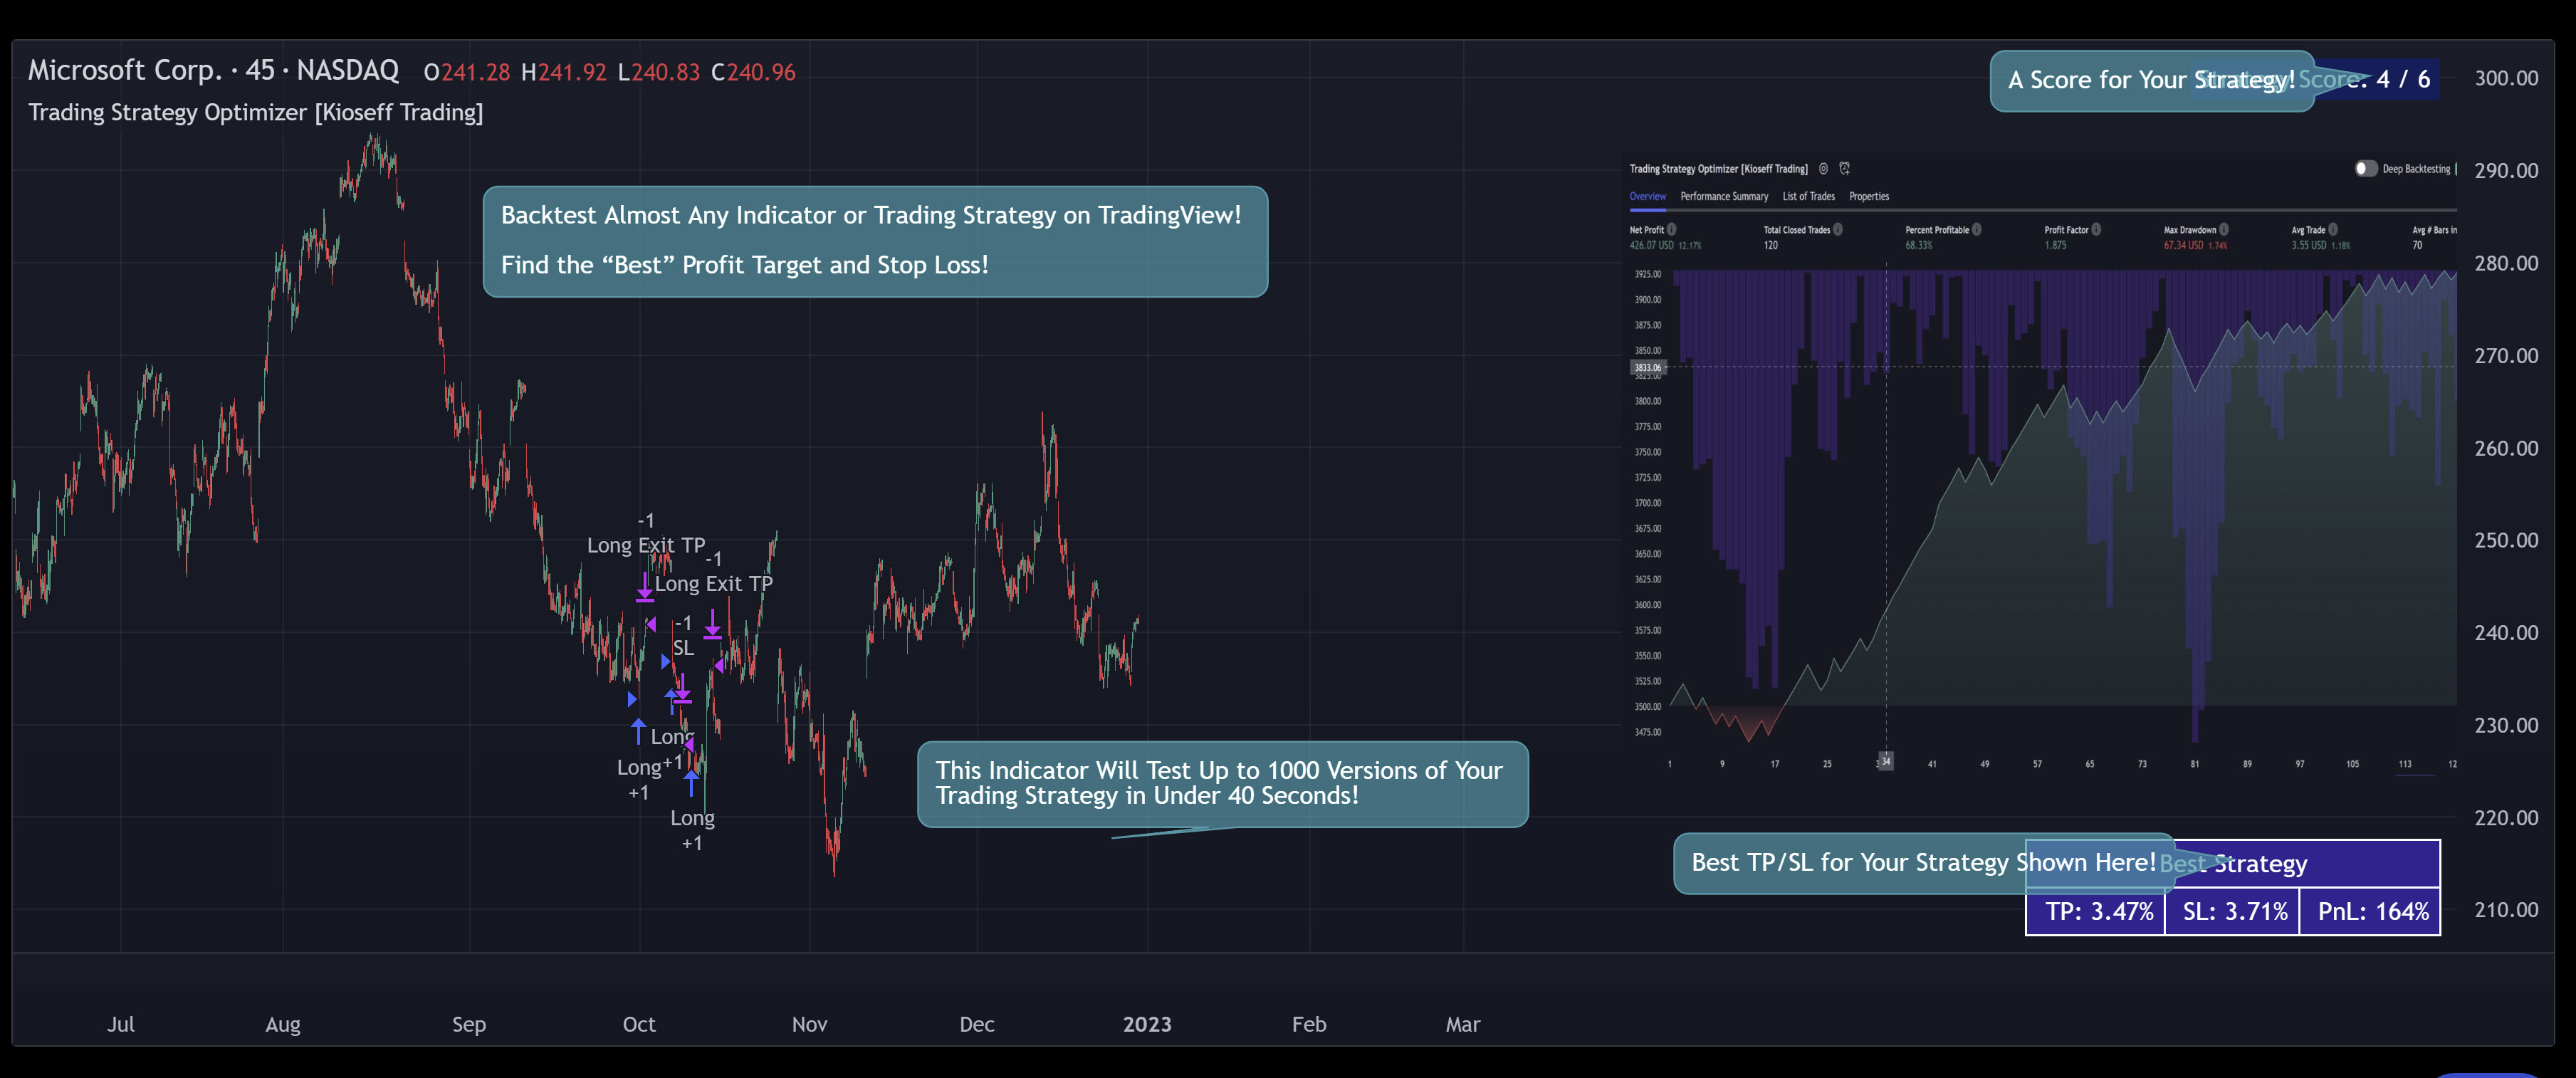
This script ( Trading Strategy Optimizer) allows the user to test up to 1000 different profit targets and stop losses for almost any trading strategy or trading indicator, simultaneously, in under 40 seconds.
Optimization results can be backtested and verified using the native TradingView backtester - which is included in the Trading Strategy Optimizer - and made easy to use! This feature makes settings alerts a simple practice!
Features
Test up to 1000 profit targets and stop losses simultaneously, in under 40 seconds.
Optimize long and short versions of your strategy.
"Best" TP 1, TP2, and TP3 levels are shown - use these to improve your profit targets.
Runs as a strategy script - profit factor, PnL , win-rate, number of trades, max drawdown, equity curve, and other pertinent statistics shown.
Alerts
Profit targets, trailing stops, and fixed stop losses can all be tested.
Your strategy can be optimized for highest win rate, highest net profit, most-efficient profit.
Limit orders can be simulated.
External indicators can be used for optimization i.e. your own, custom-built indicator, an indicator from your favorite author, or almost any publicly available
TradingView indicator.User-friendly settings for both non-coders and coders!
Found the best profit target? You can "freeze" the profit target and test up to 1000 different stop losses against it.
Found the best stop loss? You can "freeze" the stop loss and test up to 1000 different profit targets against it.
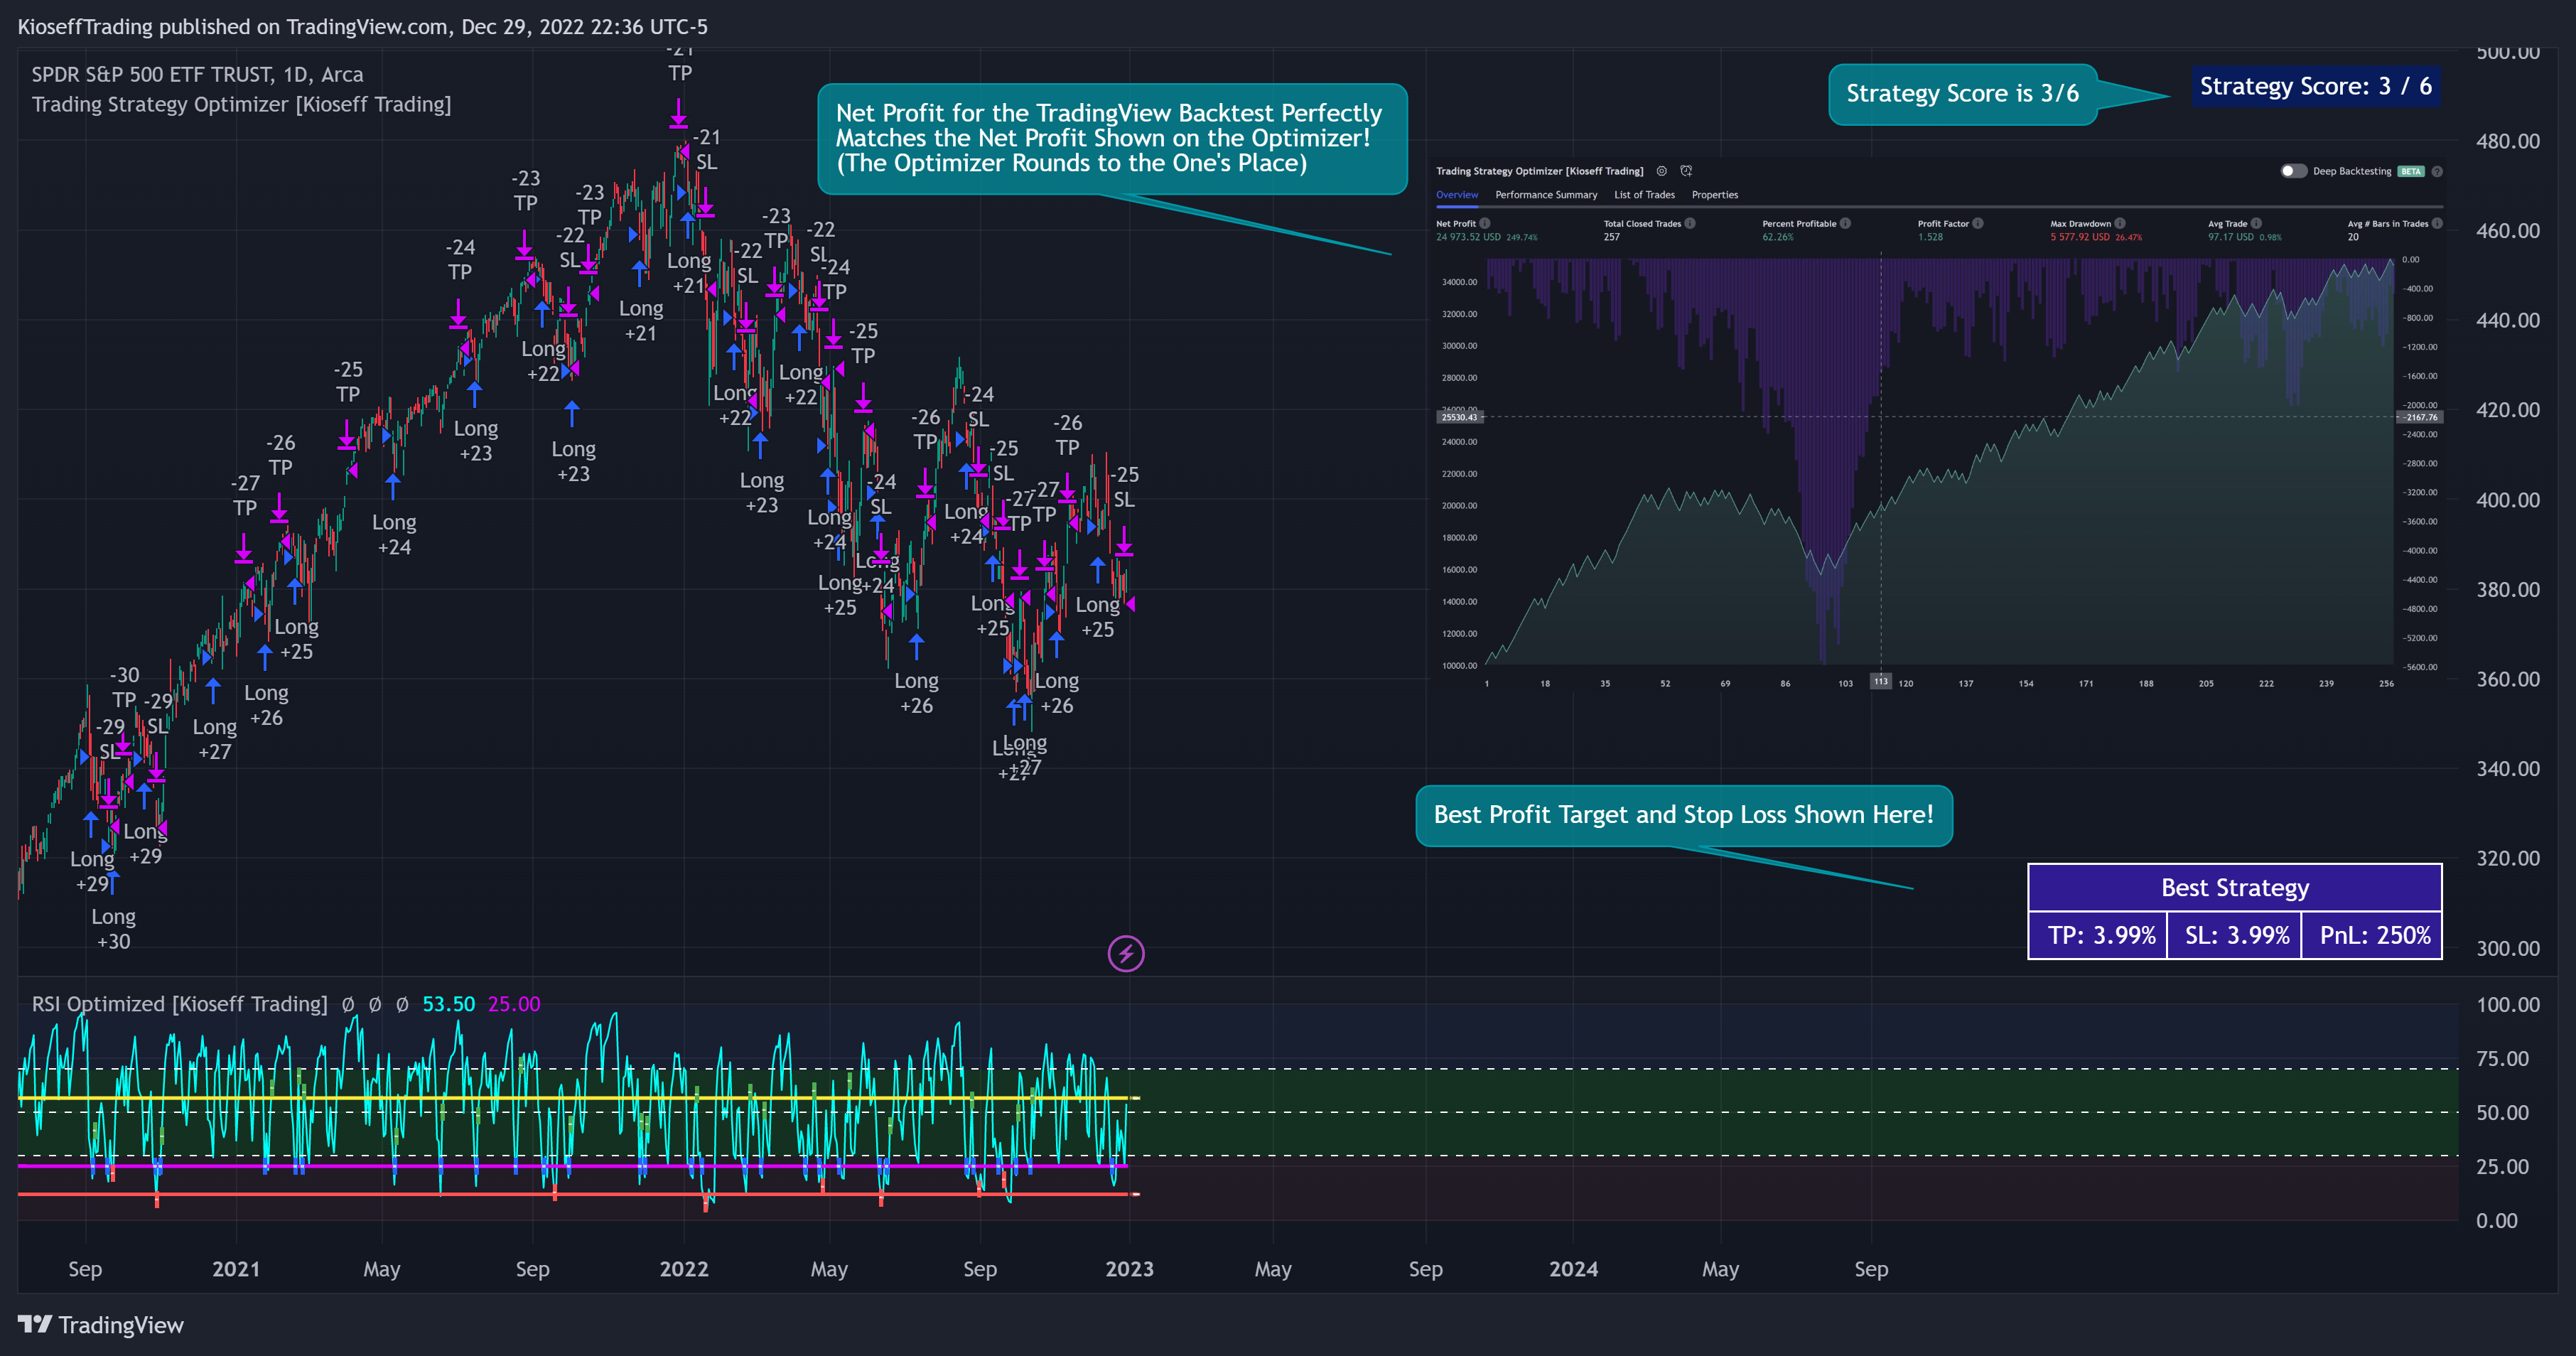
Strategy scoring - to, hopefully, help point you in the correct direction!
Explanation
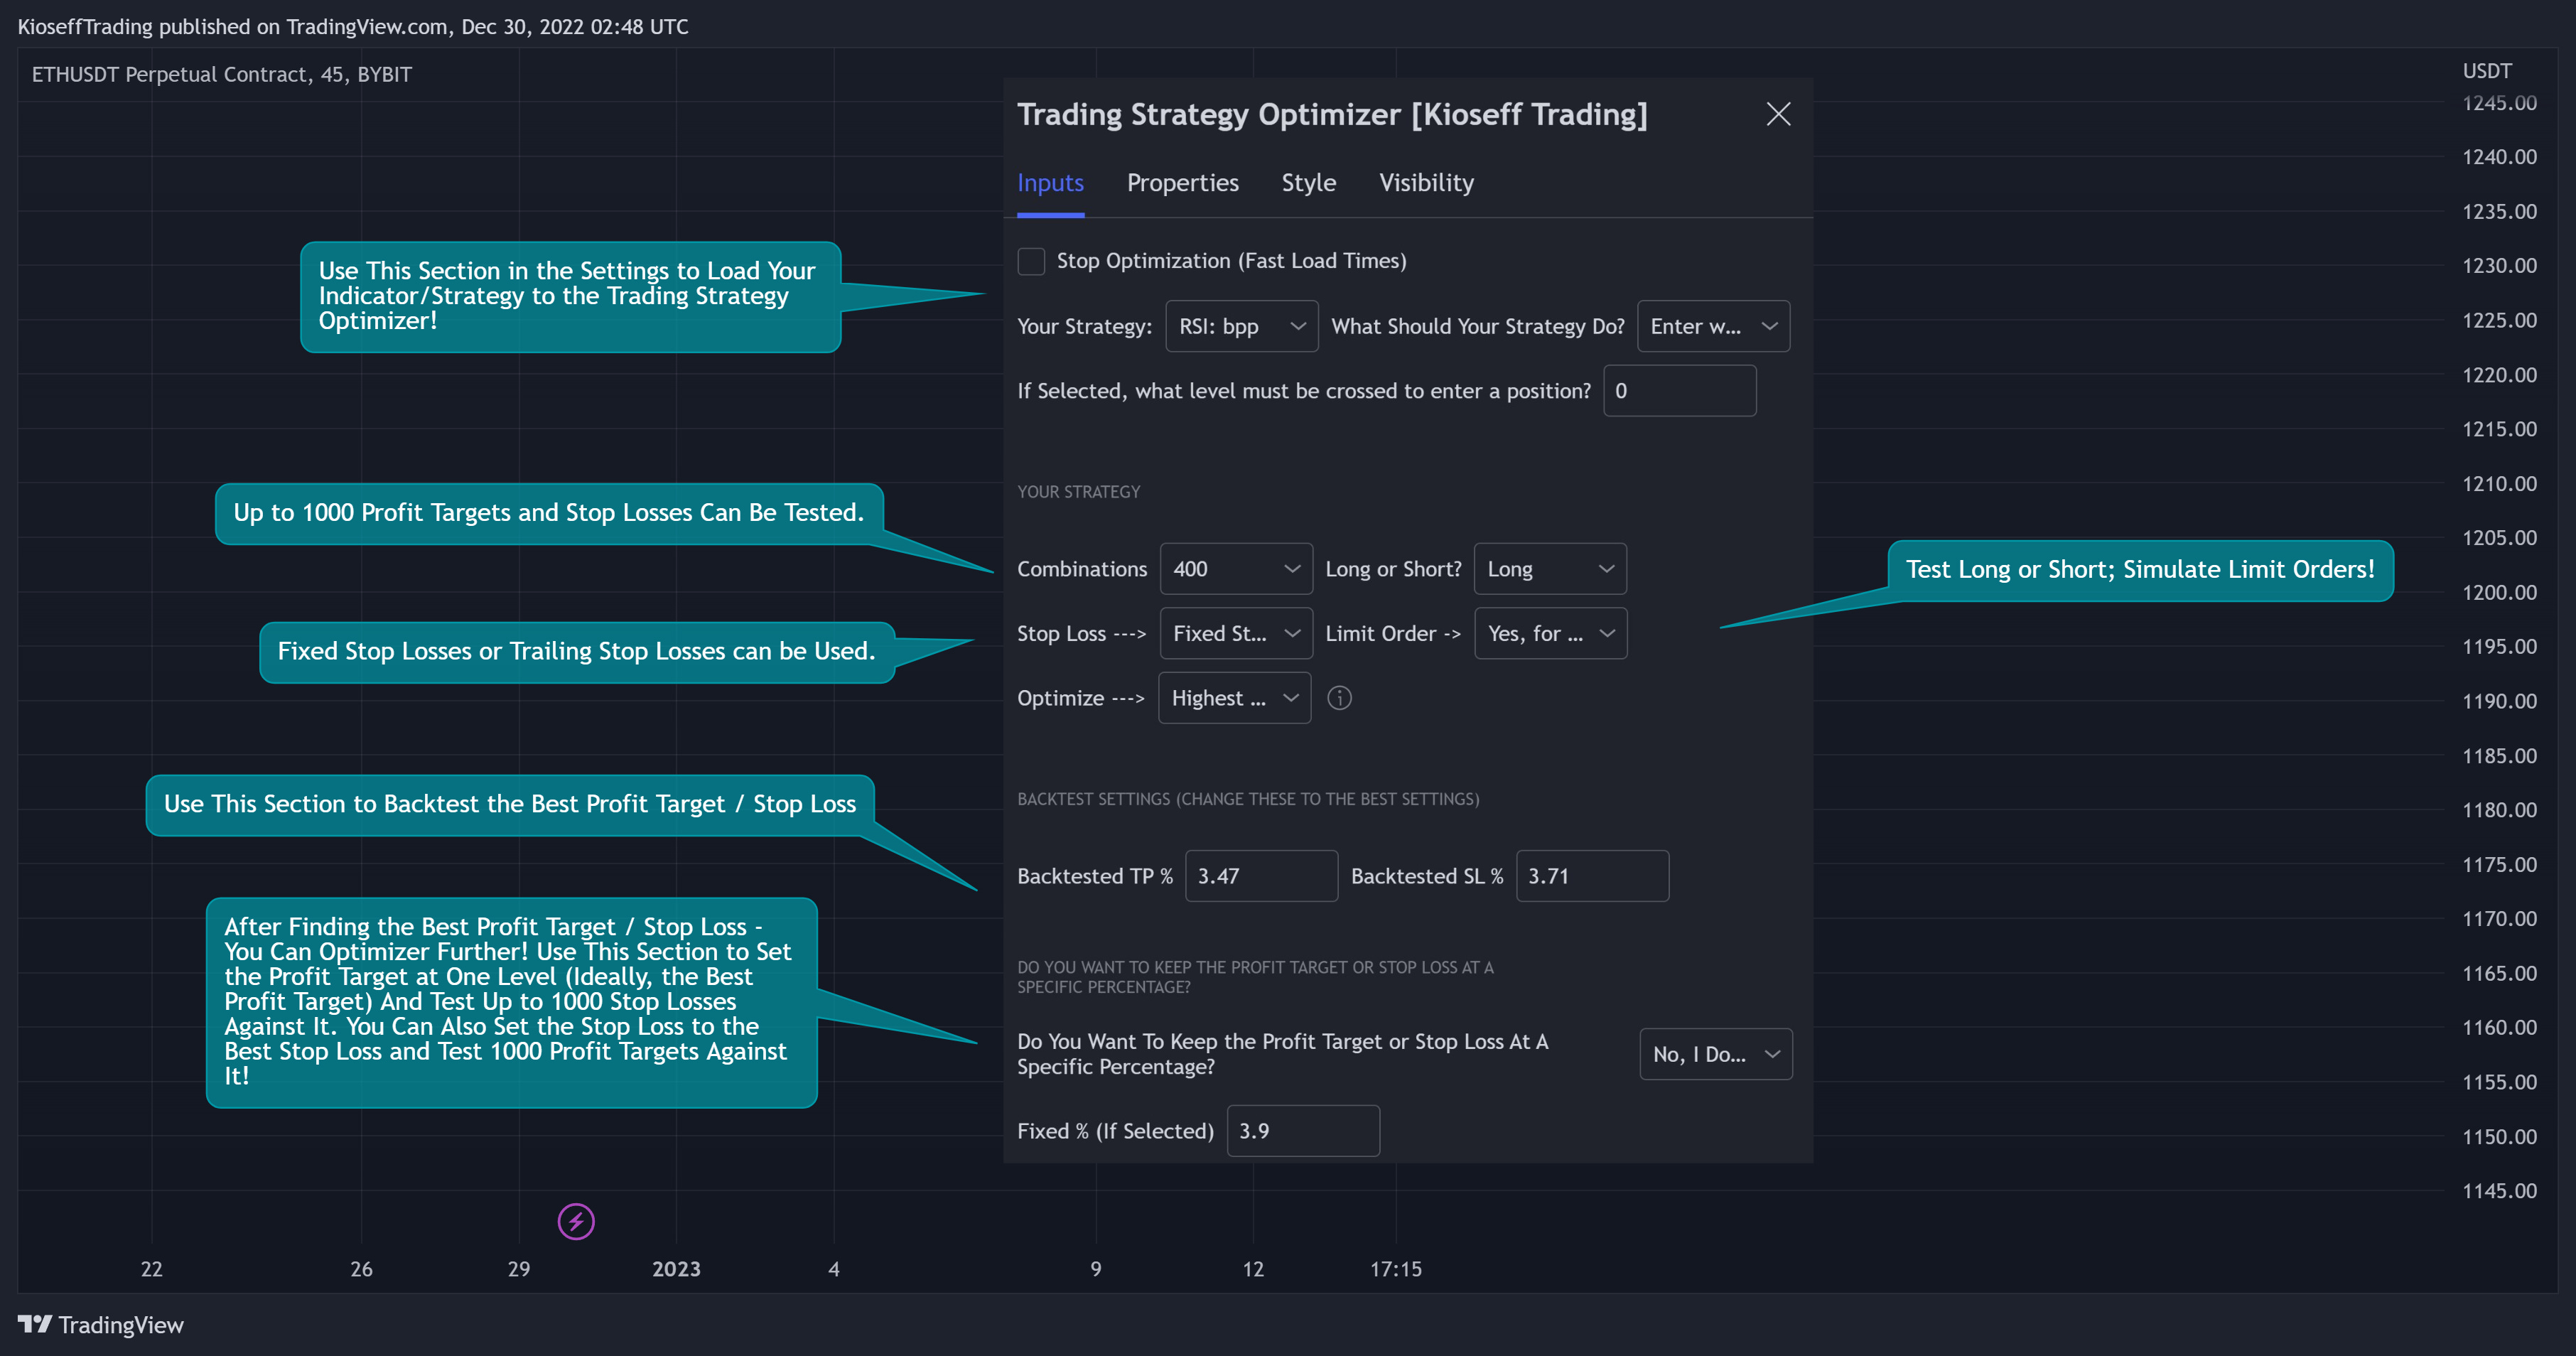
The image above shows all configurations for the optimizer; user-friendliness is prioritized!
Instructions
The Trading Strategy Optimizer complements non-coding traders and algorithmic traders!
Let's start with no-code-required instructions on how to use the optimizer!
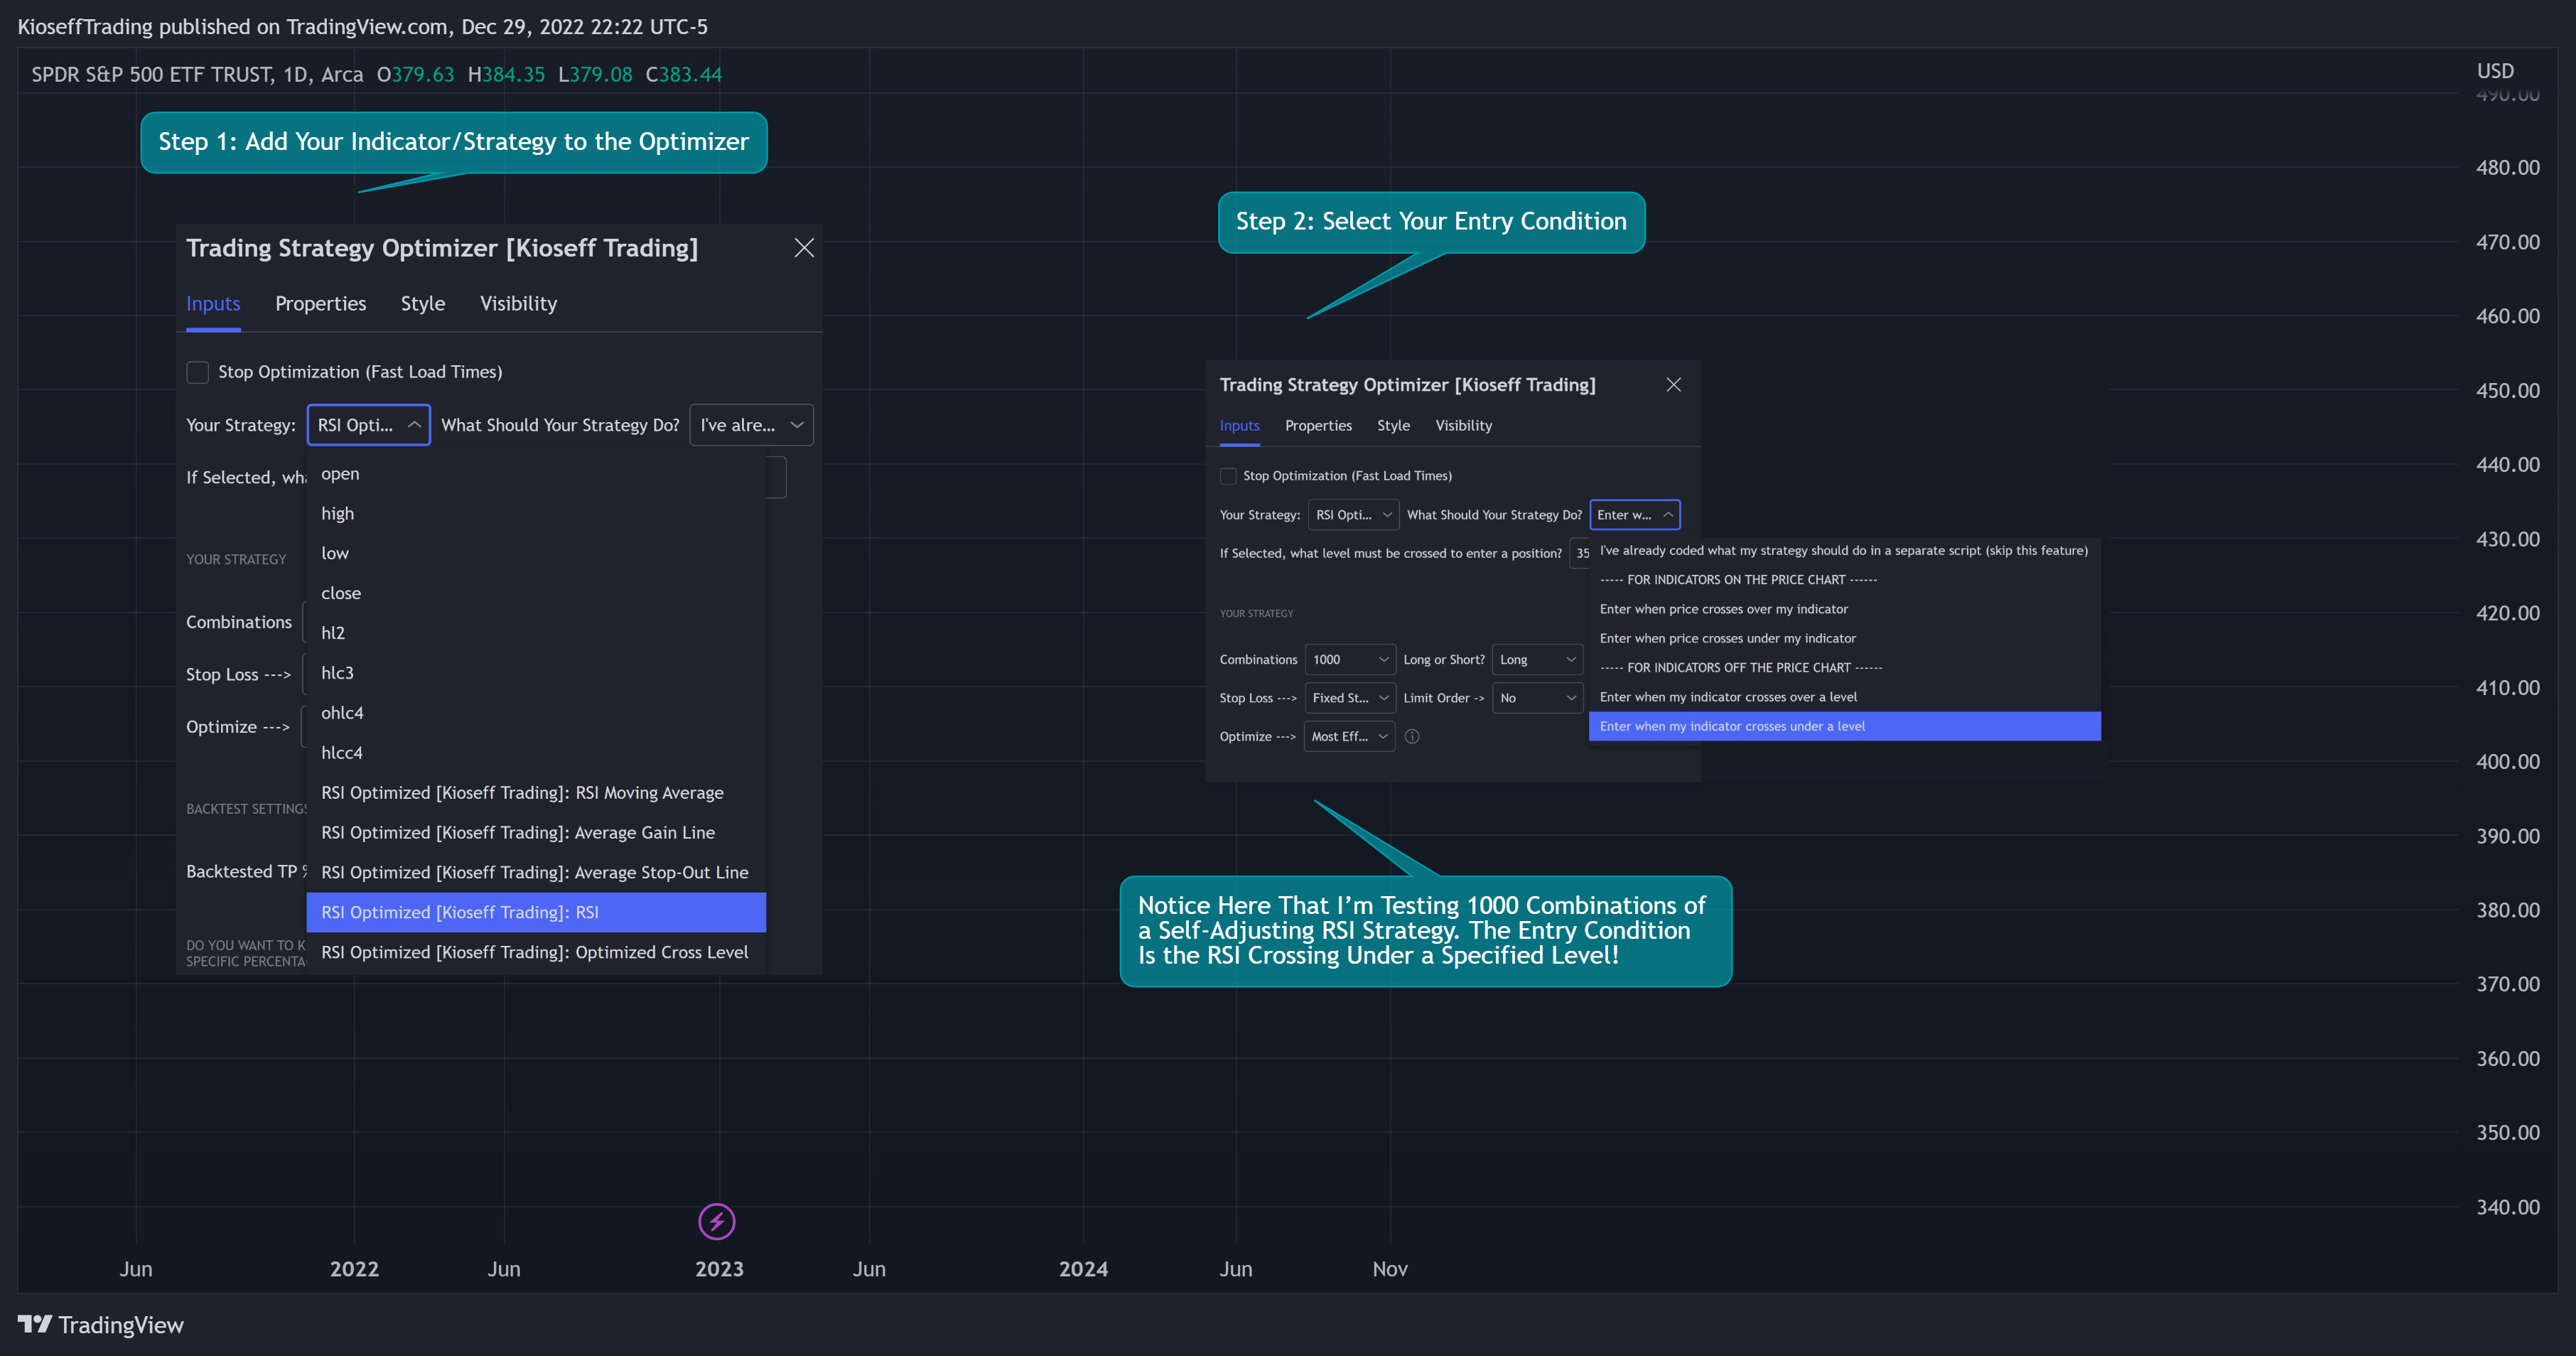
1. Build your strategy in the settings.
The image above shows my custom strategy settings.
Note: The indicator you want to test must be plotted on the same chart as the optimizer. For instance, the self-adjusting RSI strategy plots an optimized RSI on the chart.
Because the indicator is plotted on the chart and exists on the same chart as the trading strategy optimizer, I can access the self-adjusting RSI’s value and, consequently, optimize profit targets and stop losses for it.
If you've any trouble with this step - feel free to message me for instructions!
2. Test Your Strategy
Once you've added your indicator/strategy to the optimizer and selected your entry condition the Trading Strategy Optimizer will immediately begin testing profit targets and stop losses!
Now that you've got some data on your chart - you should try "Freezing" the profit target and stop loss!
When you freeze the profit target the Trading Strategy Optimizer will test up to 1000 different stop losses against the frozen profit target.
When you freeze the stop loss the Trading Strategy Optimizer will test up to 1000 different profit targets against the frozen stop loss.
Exploiting this feature may help you find a better profit target and stop-loss combination, in addition to a better theoretical reward-to-risk.
3. "Freeze" the profit target or stop loss.
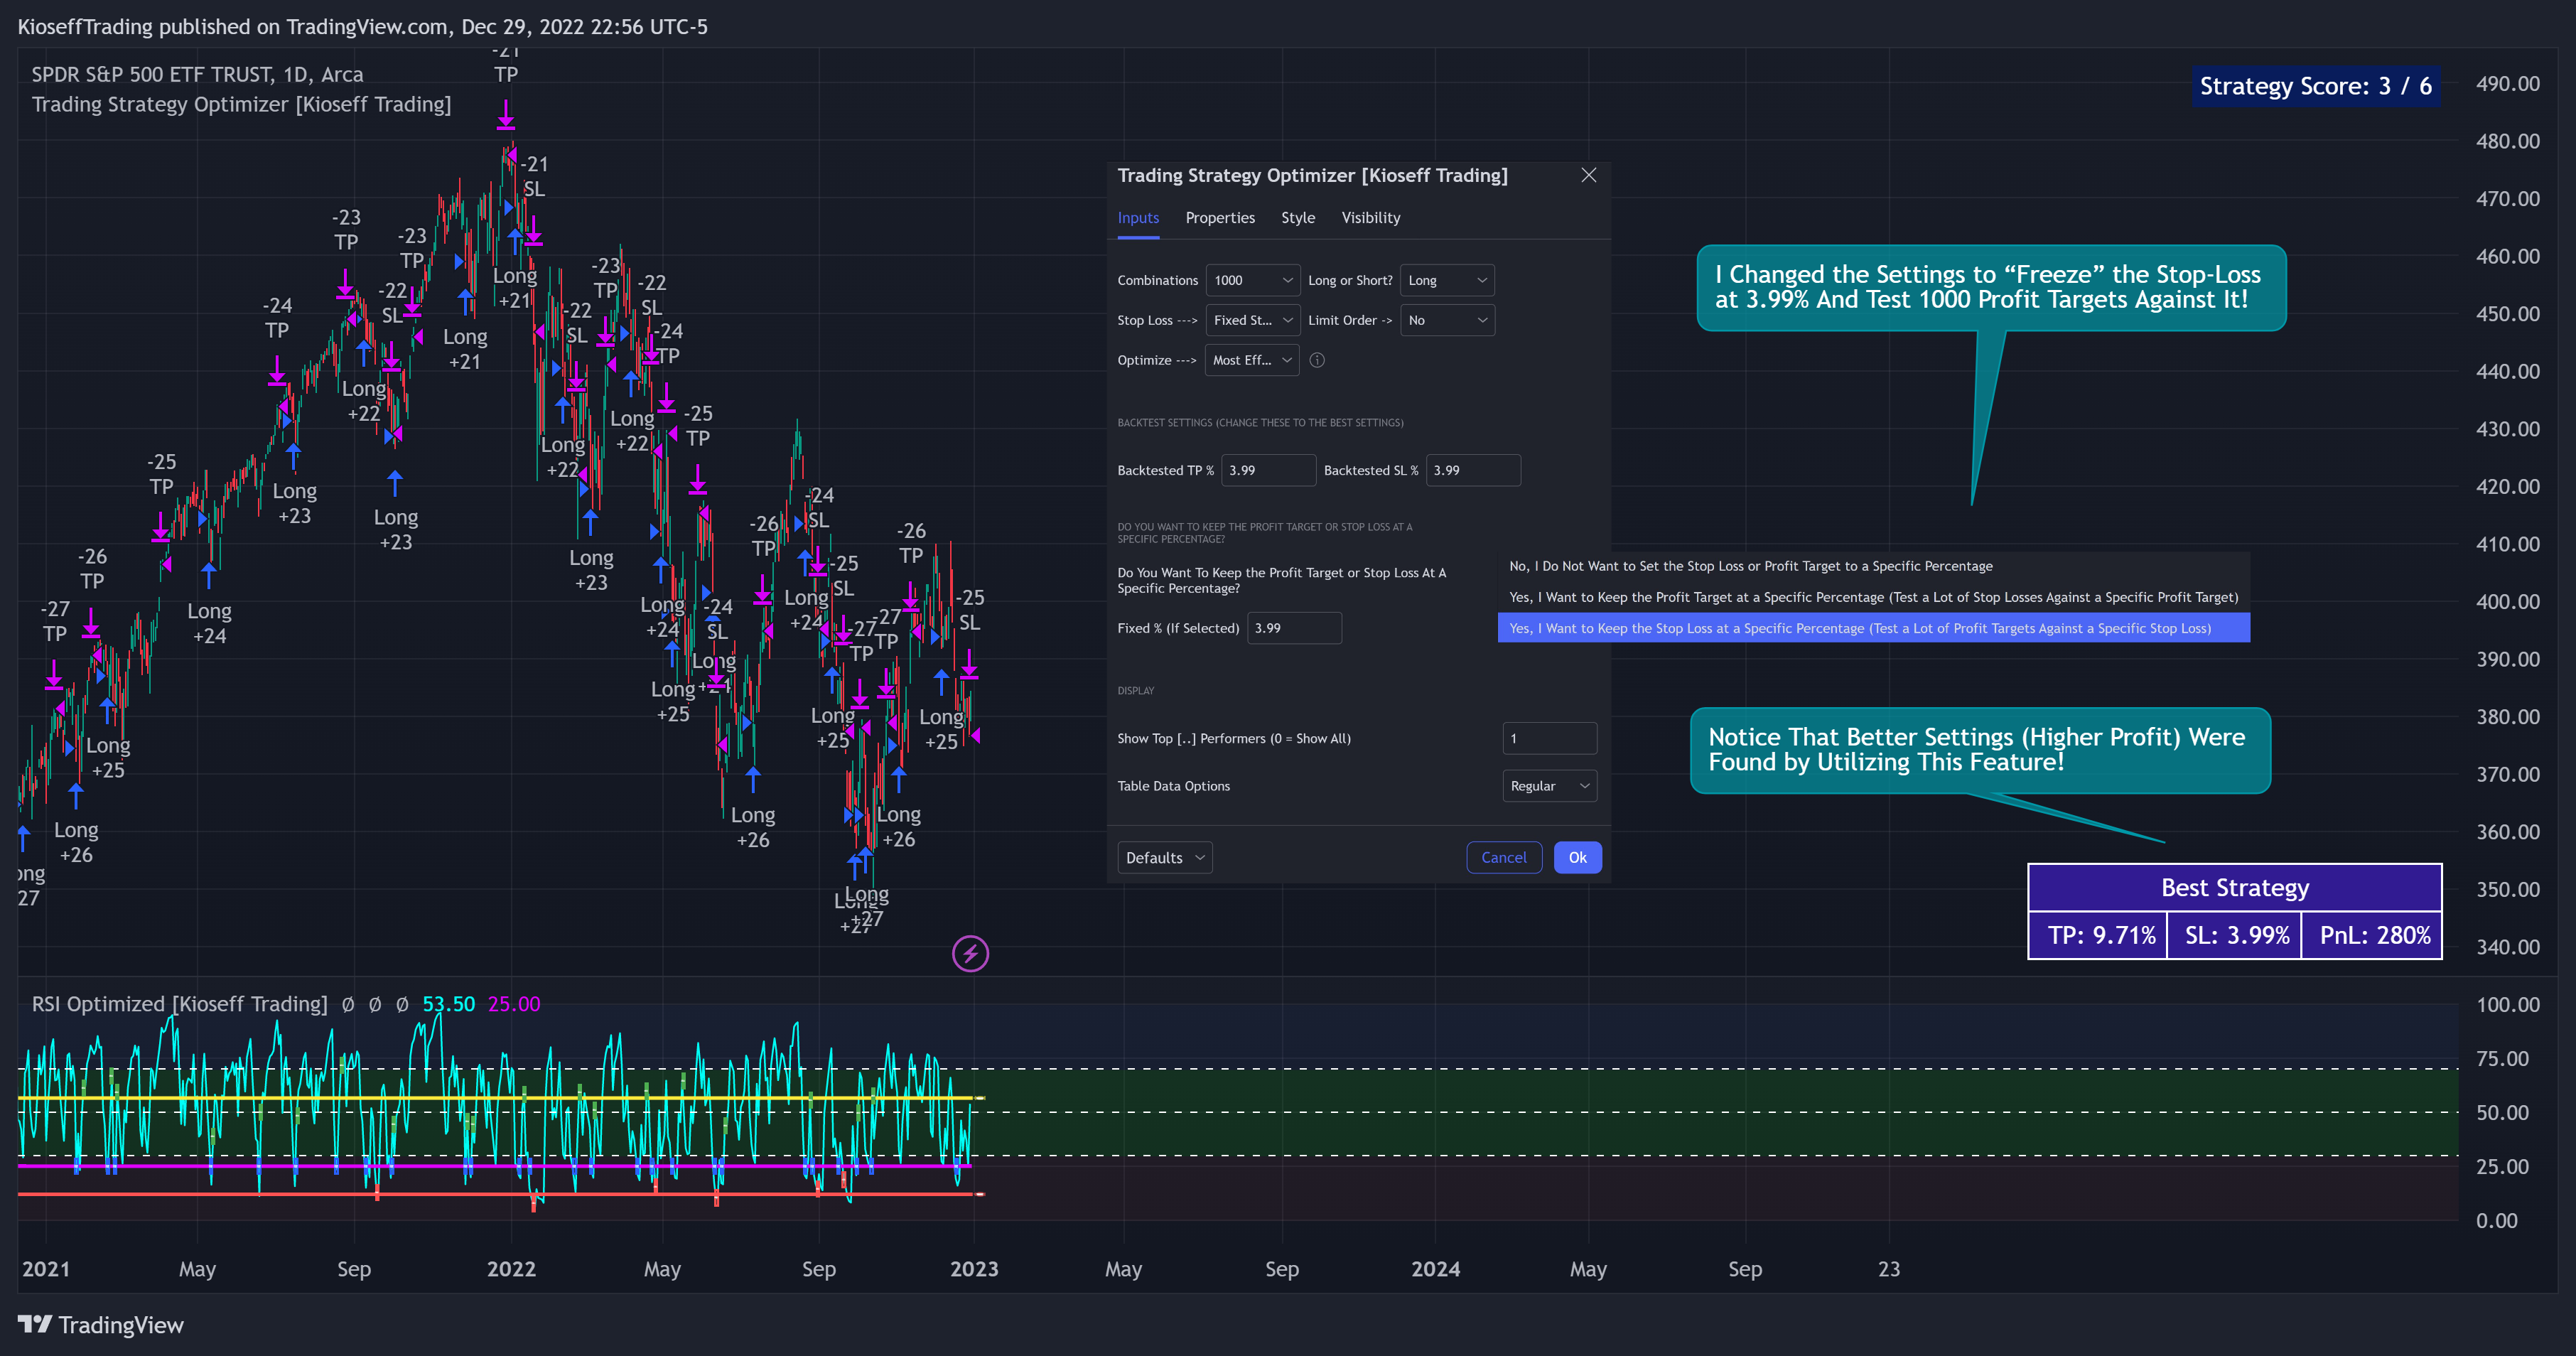
The image above shows me freezing the stop loss at 3.99%. Doing this returned a better-performing profit target and a "better" reward-risk ratio!
With this information, we can execute a TradingView backtest.
3. Execute a TradingView Backtest.
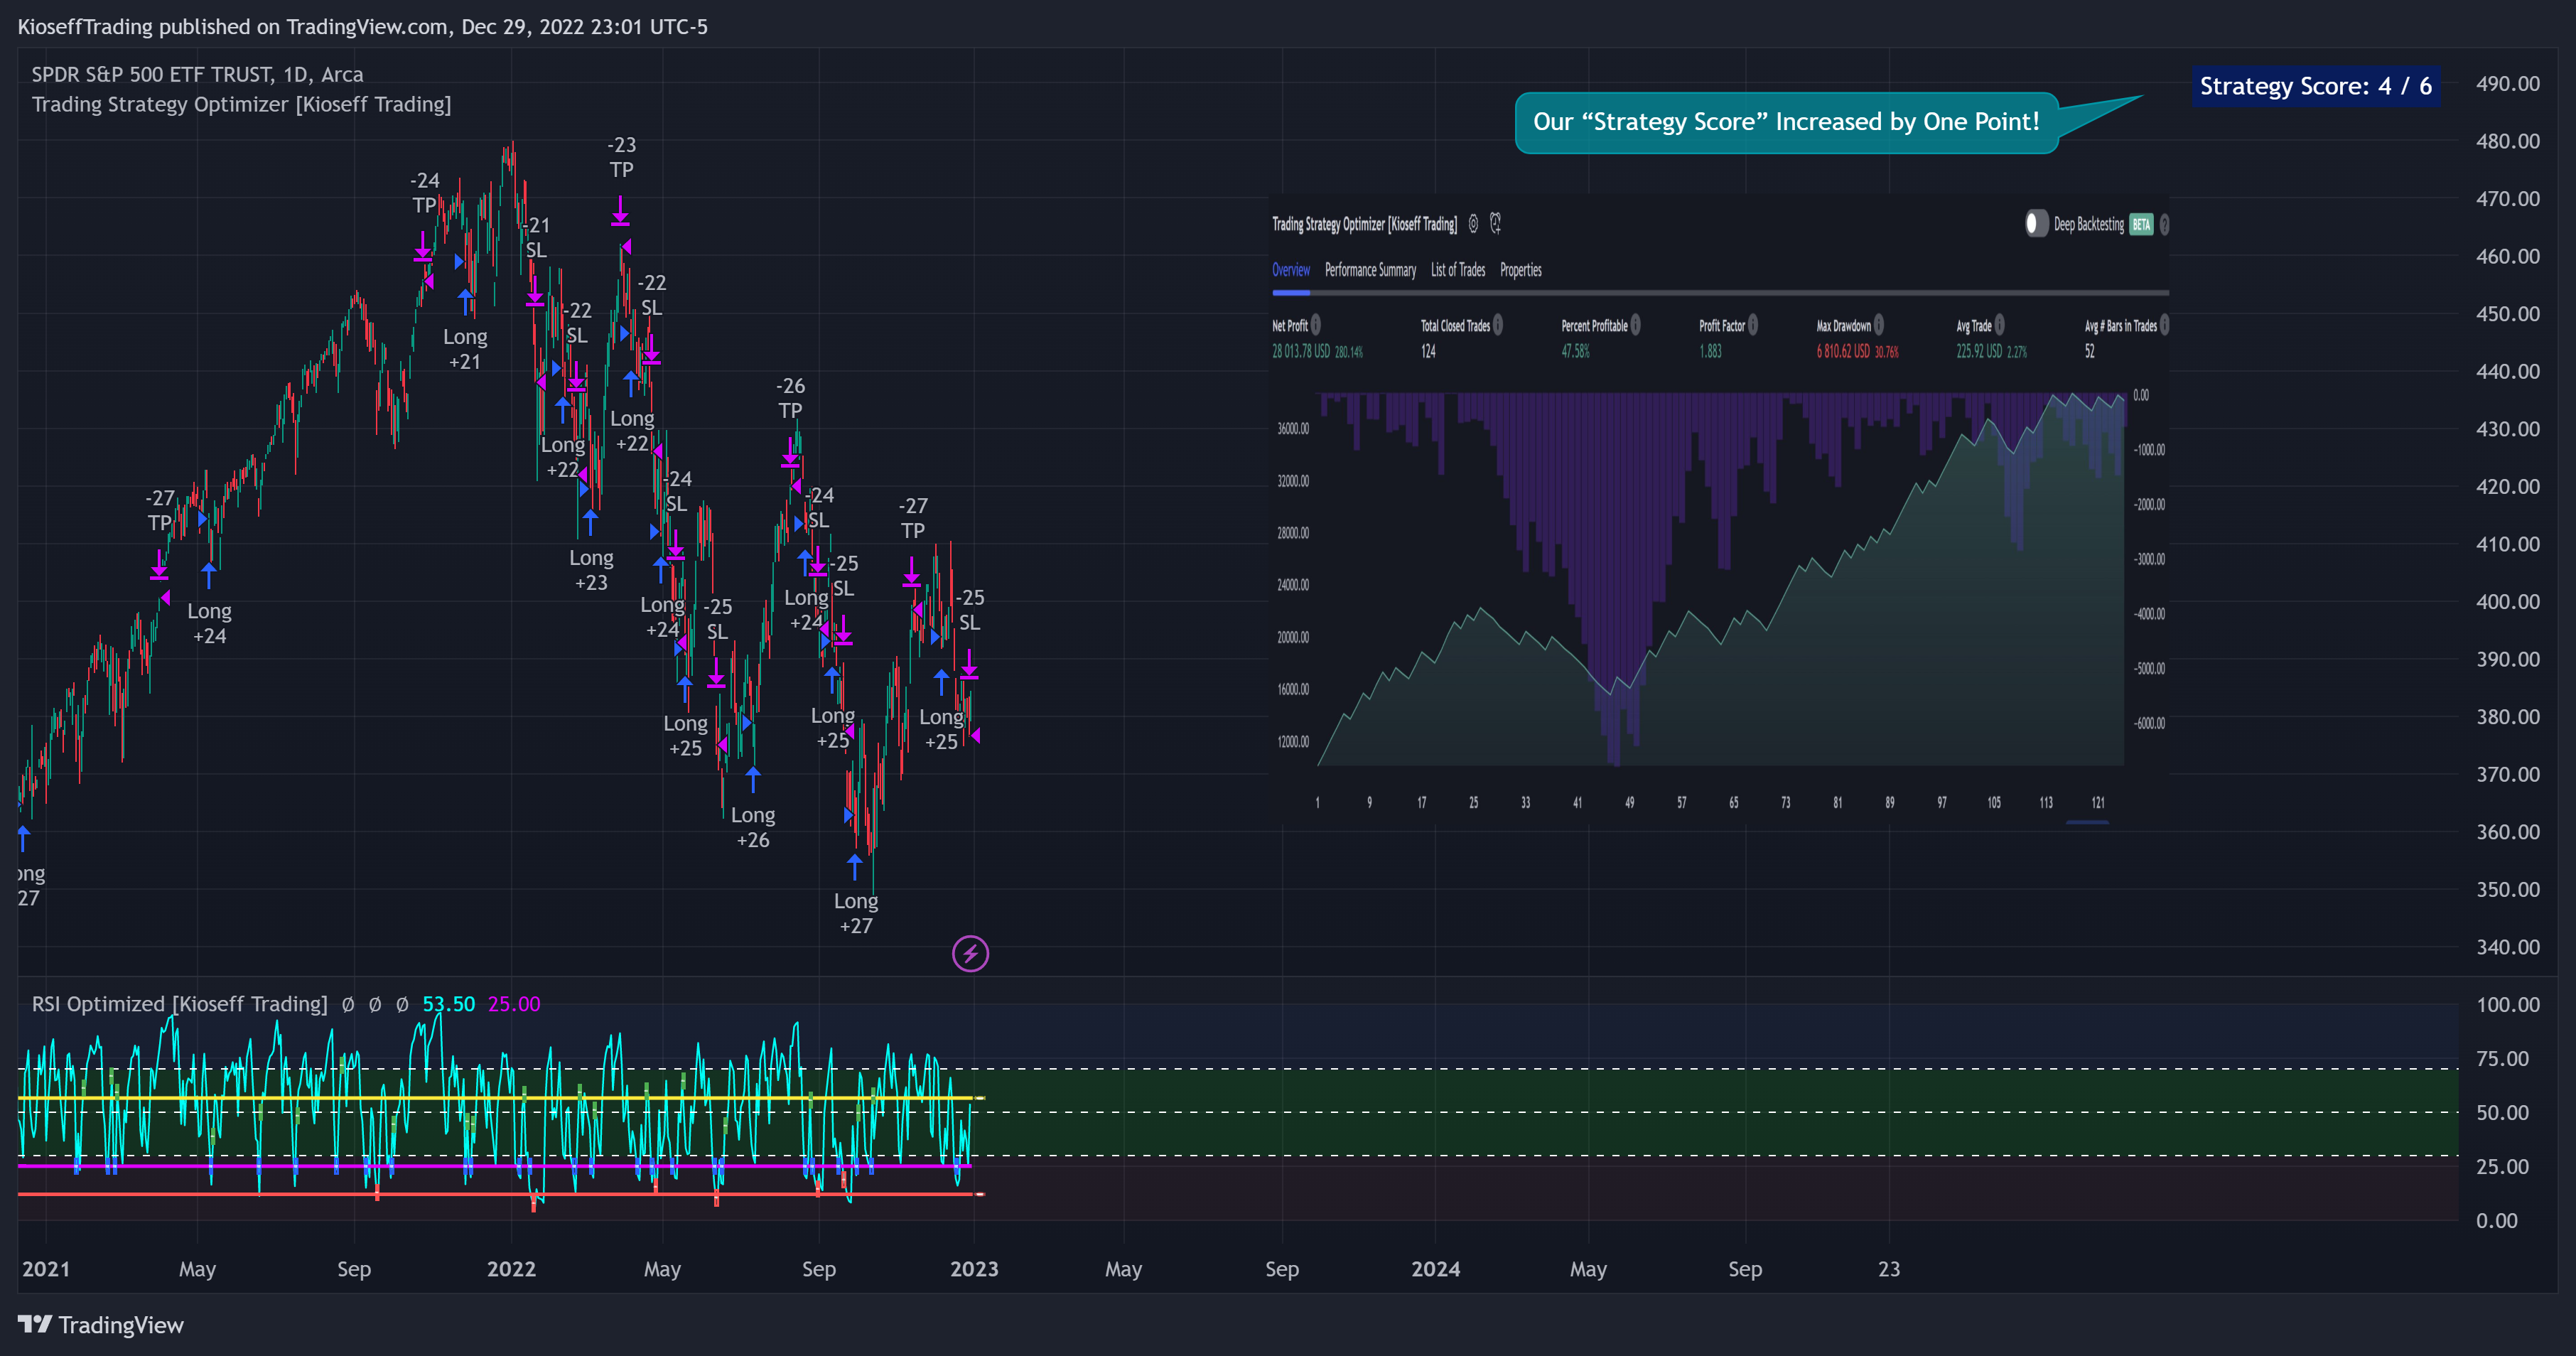
The image above shows the completion of the process!
From here, you can perform further testing, set alerts, etc.
Code-Required Instructions (Optional)
You can backtest more code-intensive strategies, such as harmonic patterns , traditional chart patterns, candlestick patterns, elliot wave , etc., by coding the entry condition in your own script and loading it into the Trading Strategy Optimizer.
Let's dial in on how to achieve this!
1. You must create an integer variable in your script with an initial value of "0".
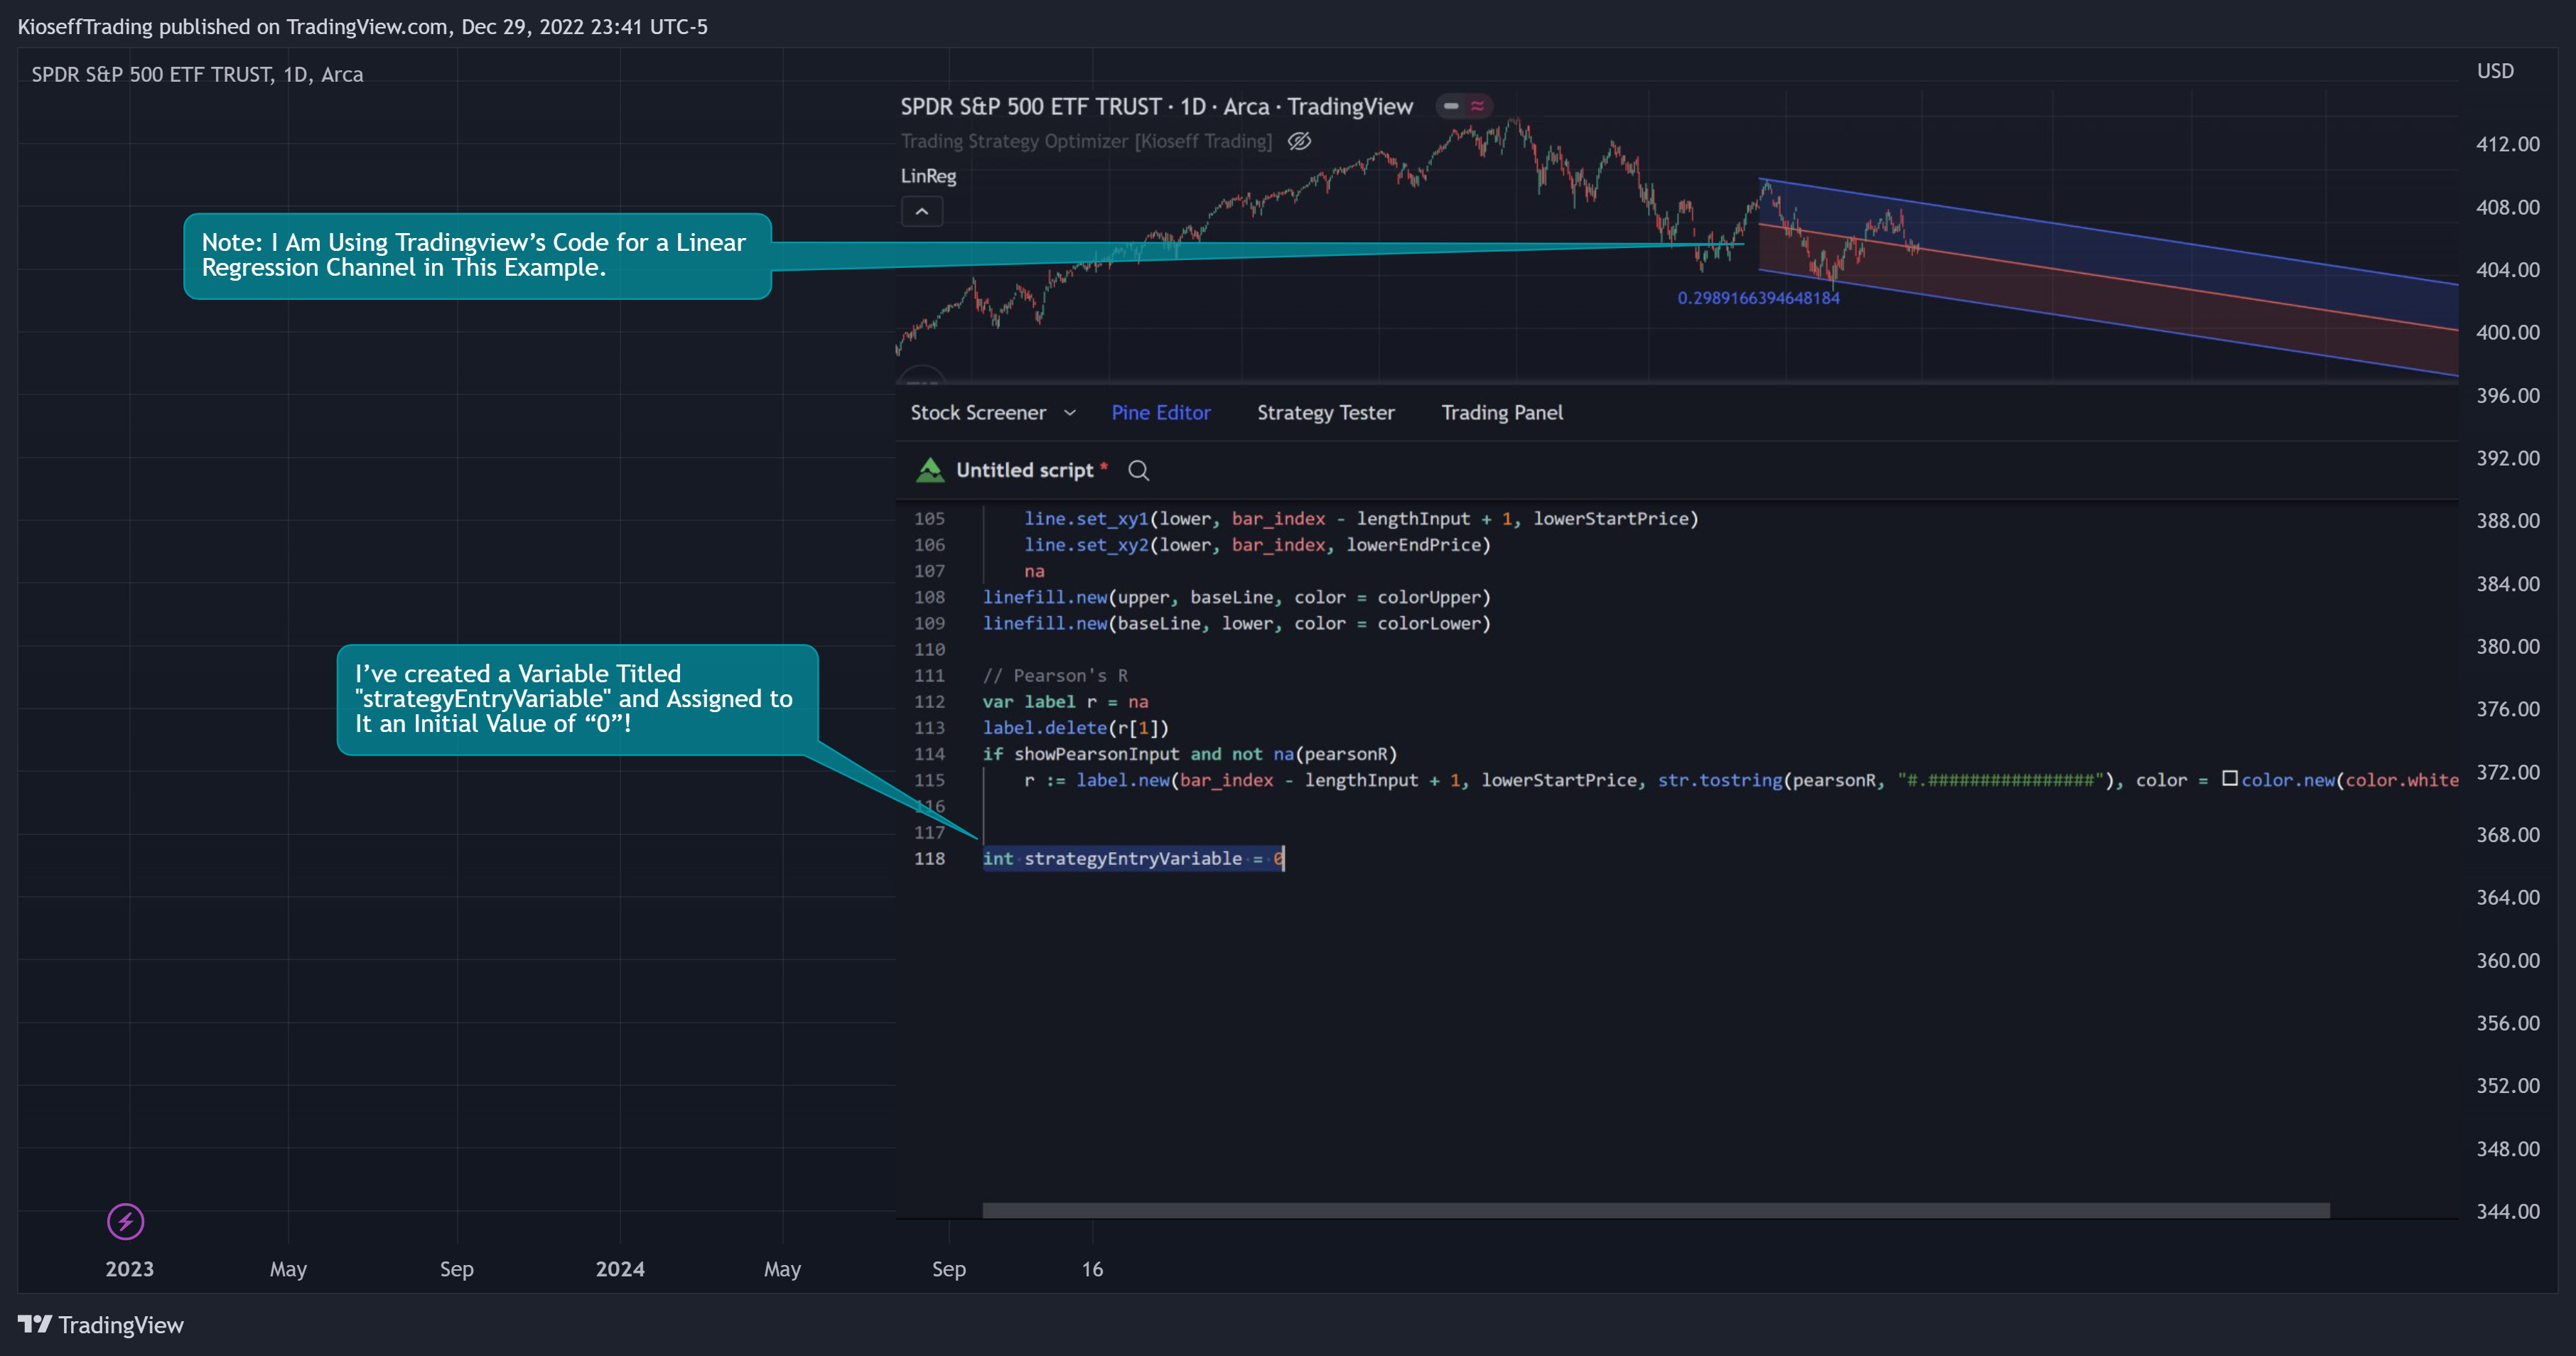
The image above shows a variable I created and assigned a value of "0" to!
2. Define your entry condition in the code. Once complete, assign the value "1" to the variable you created if the entry condition is fulfilled.
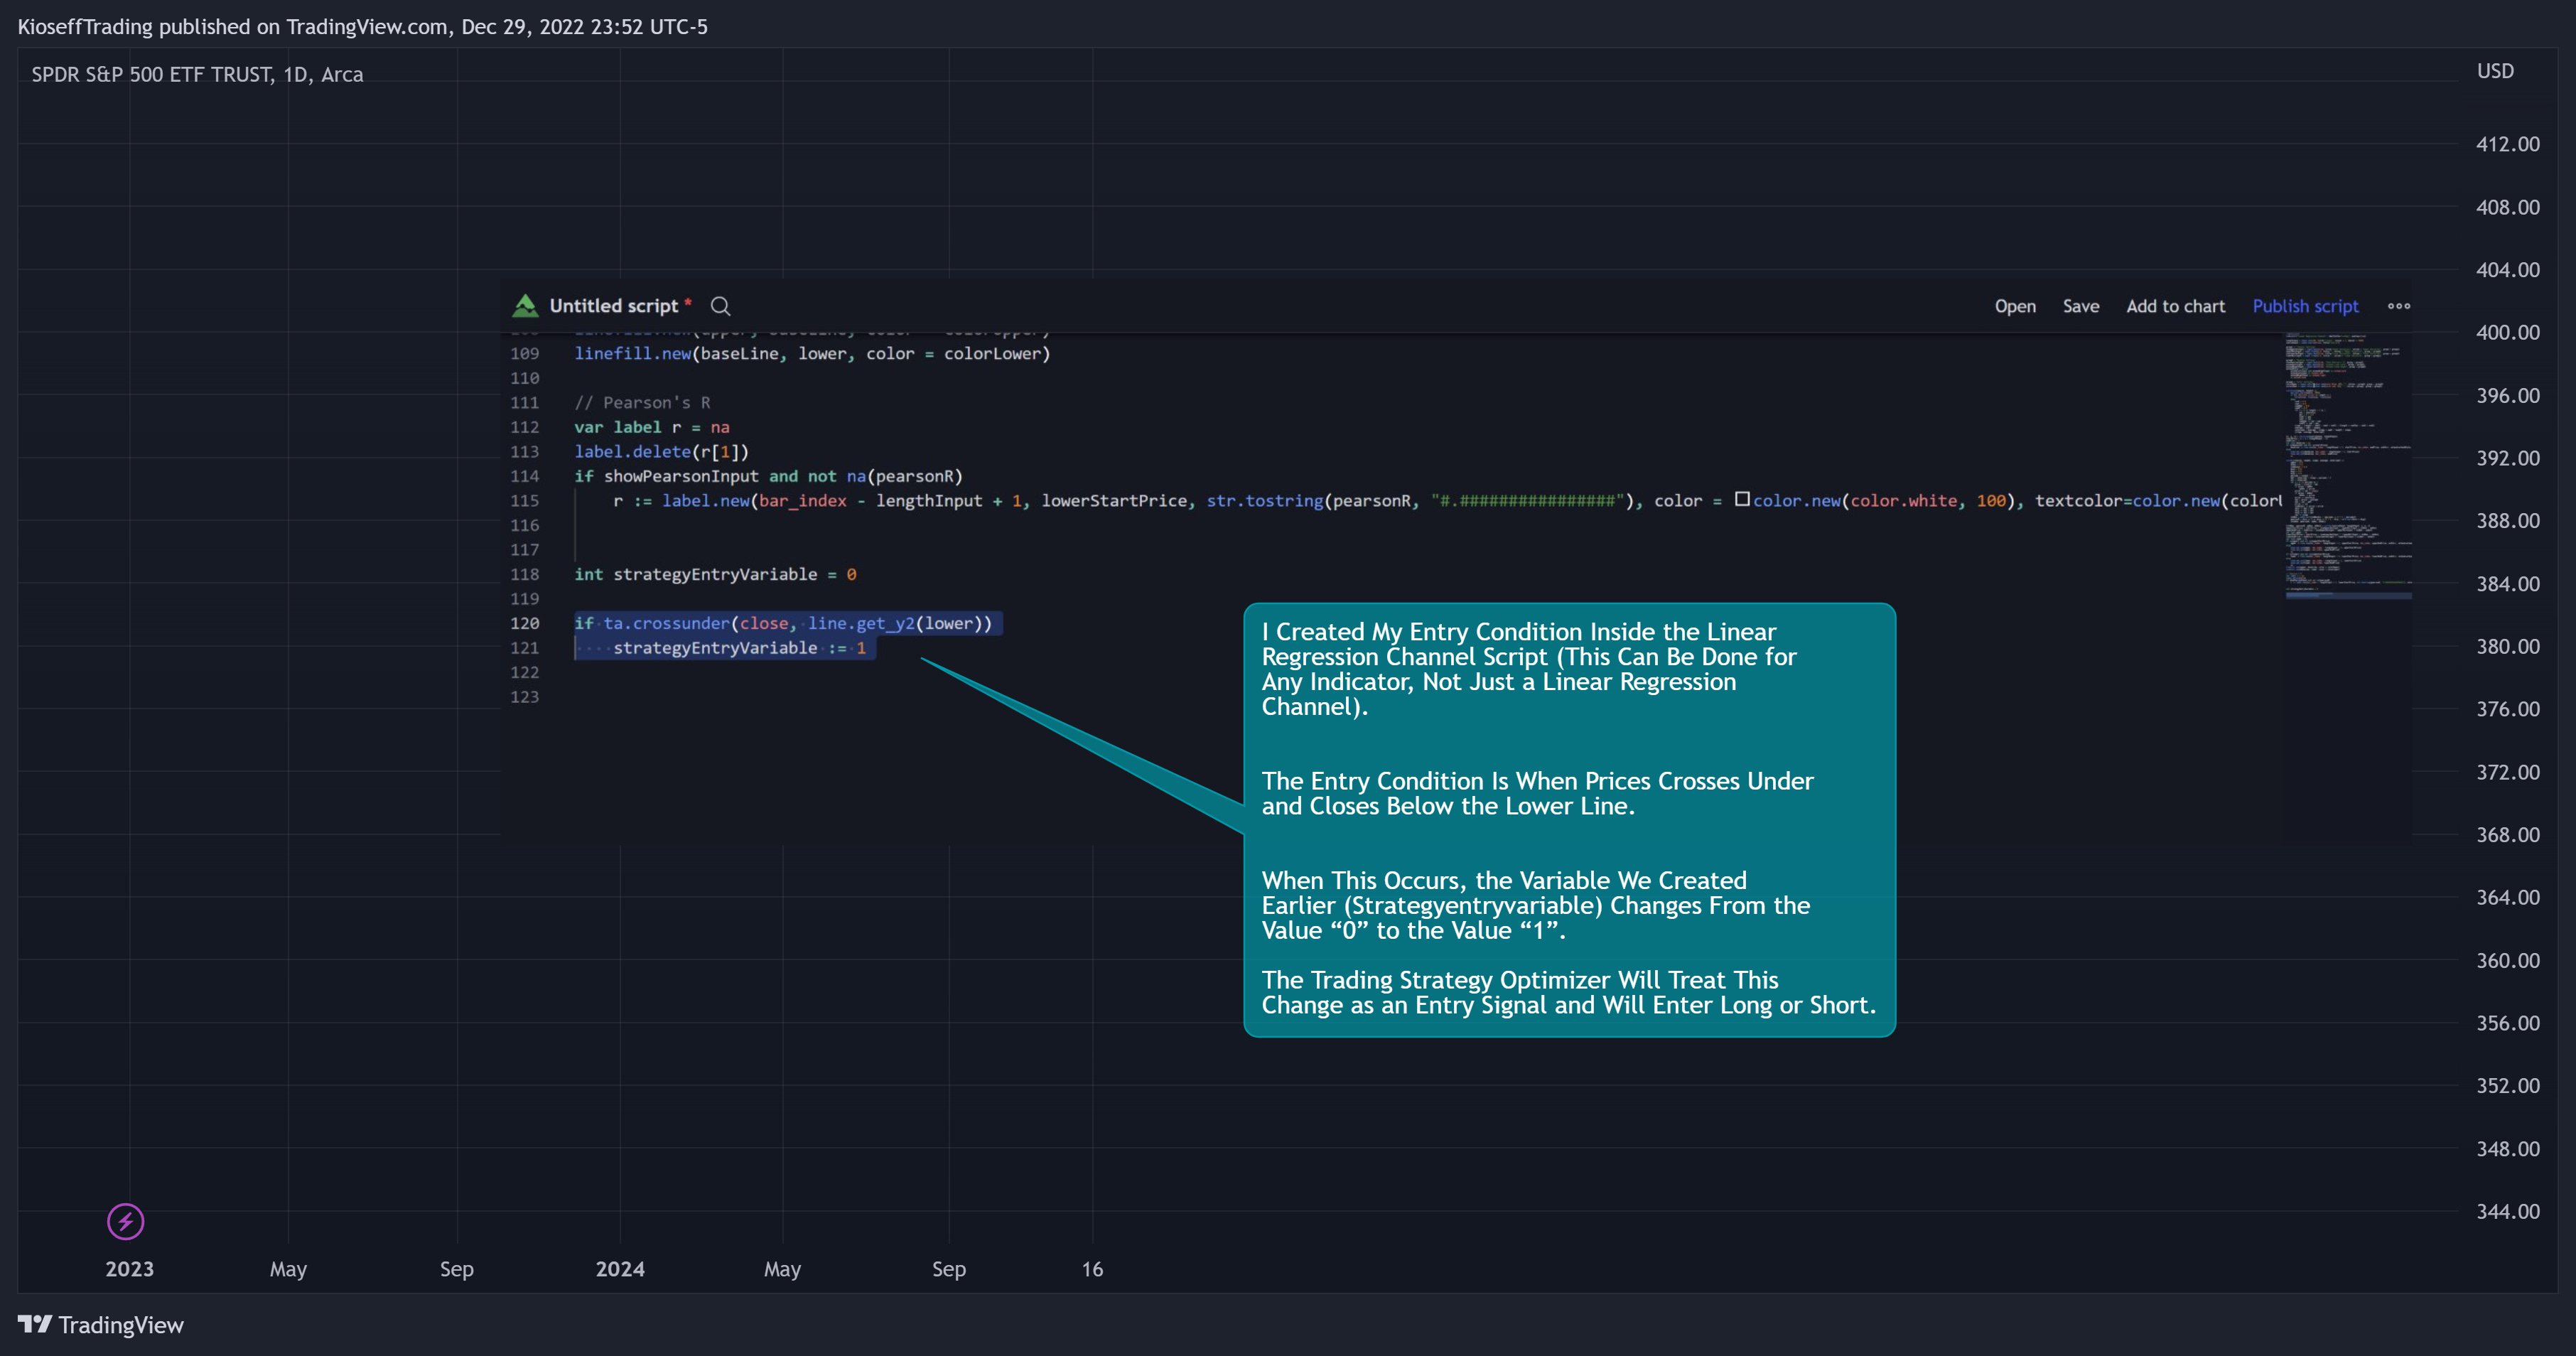
The image above shows a coded entry condition for the linear regression channel (which can be any indicator). When price crosses under and closes below the lower line our variable "strategyEntryVariable" is assigned the value "1".
The Trading Strategy Optimizer will treat this change in value from "0" to "1" as an entry signal and enter long/short up to 1000 times at the price where the entry condition was fulfilled.
3. Plot the variable
For step 3, simply plot the variable you created (the one that tracks the entry condition).
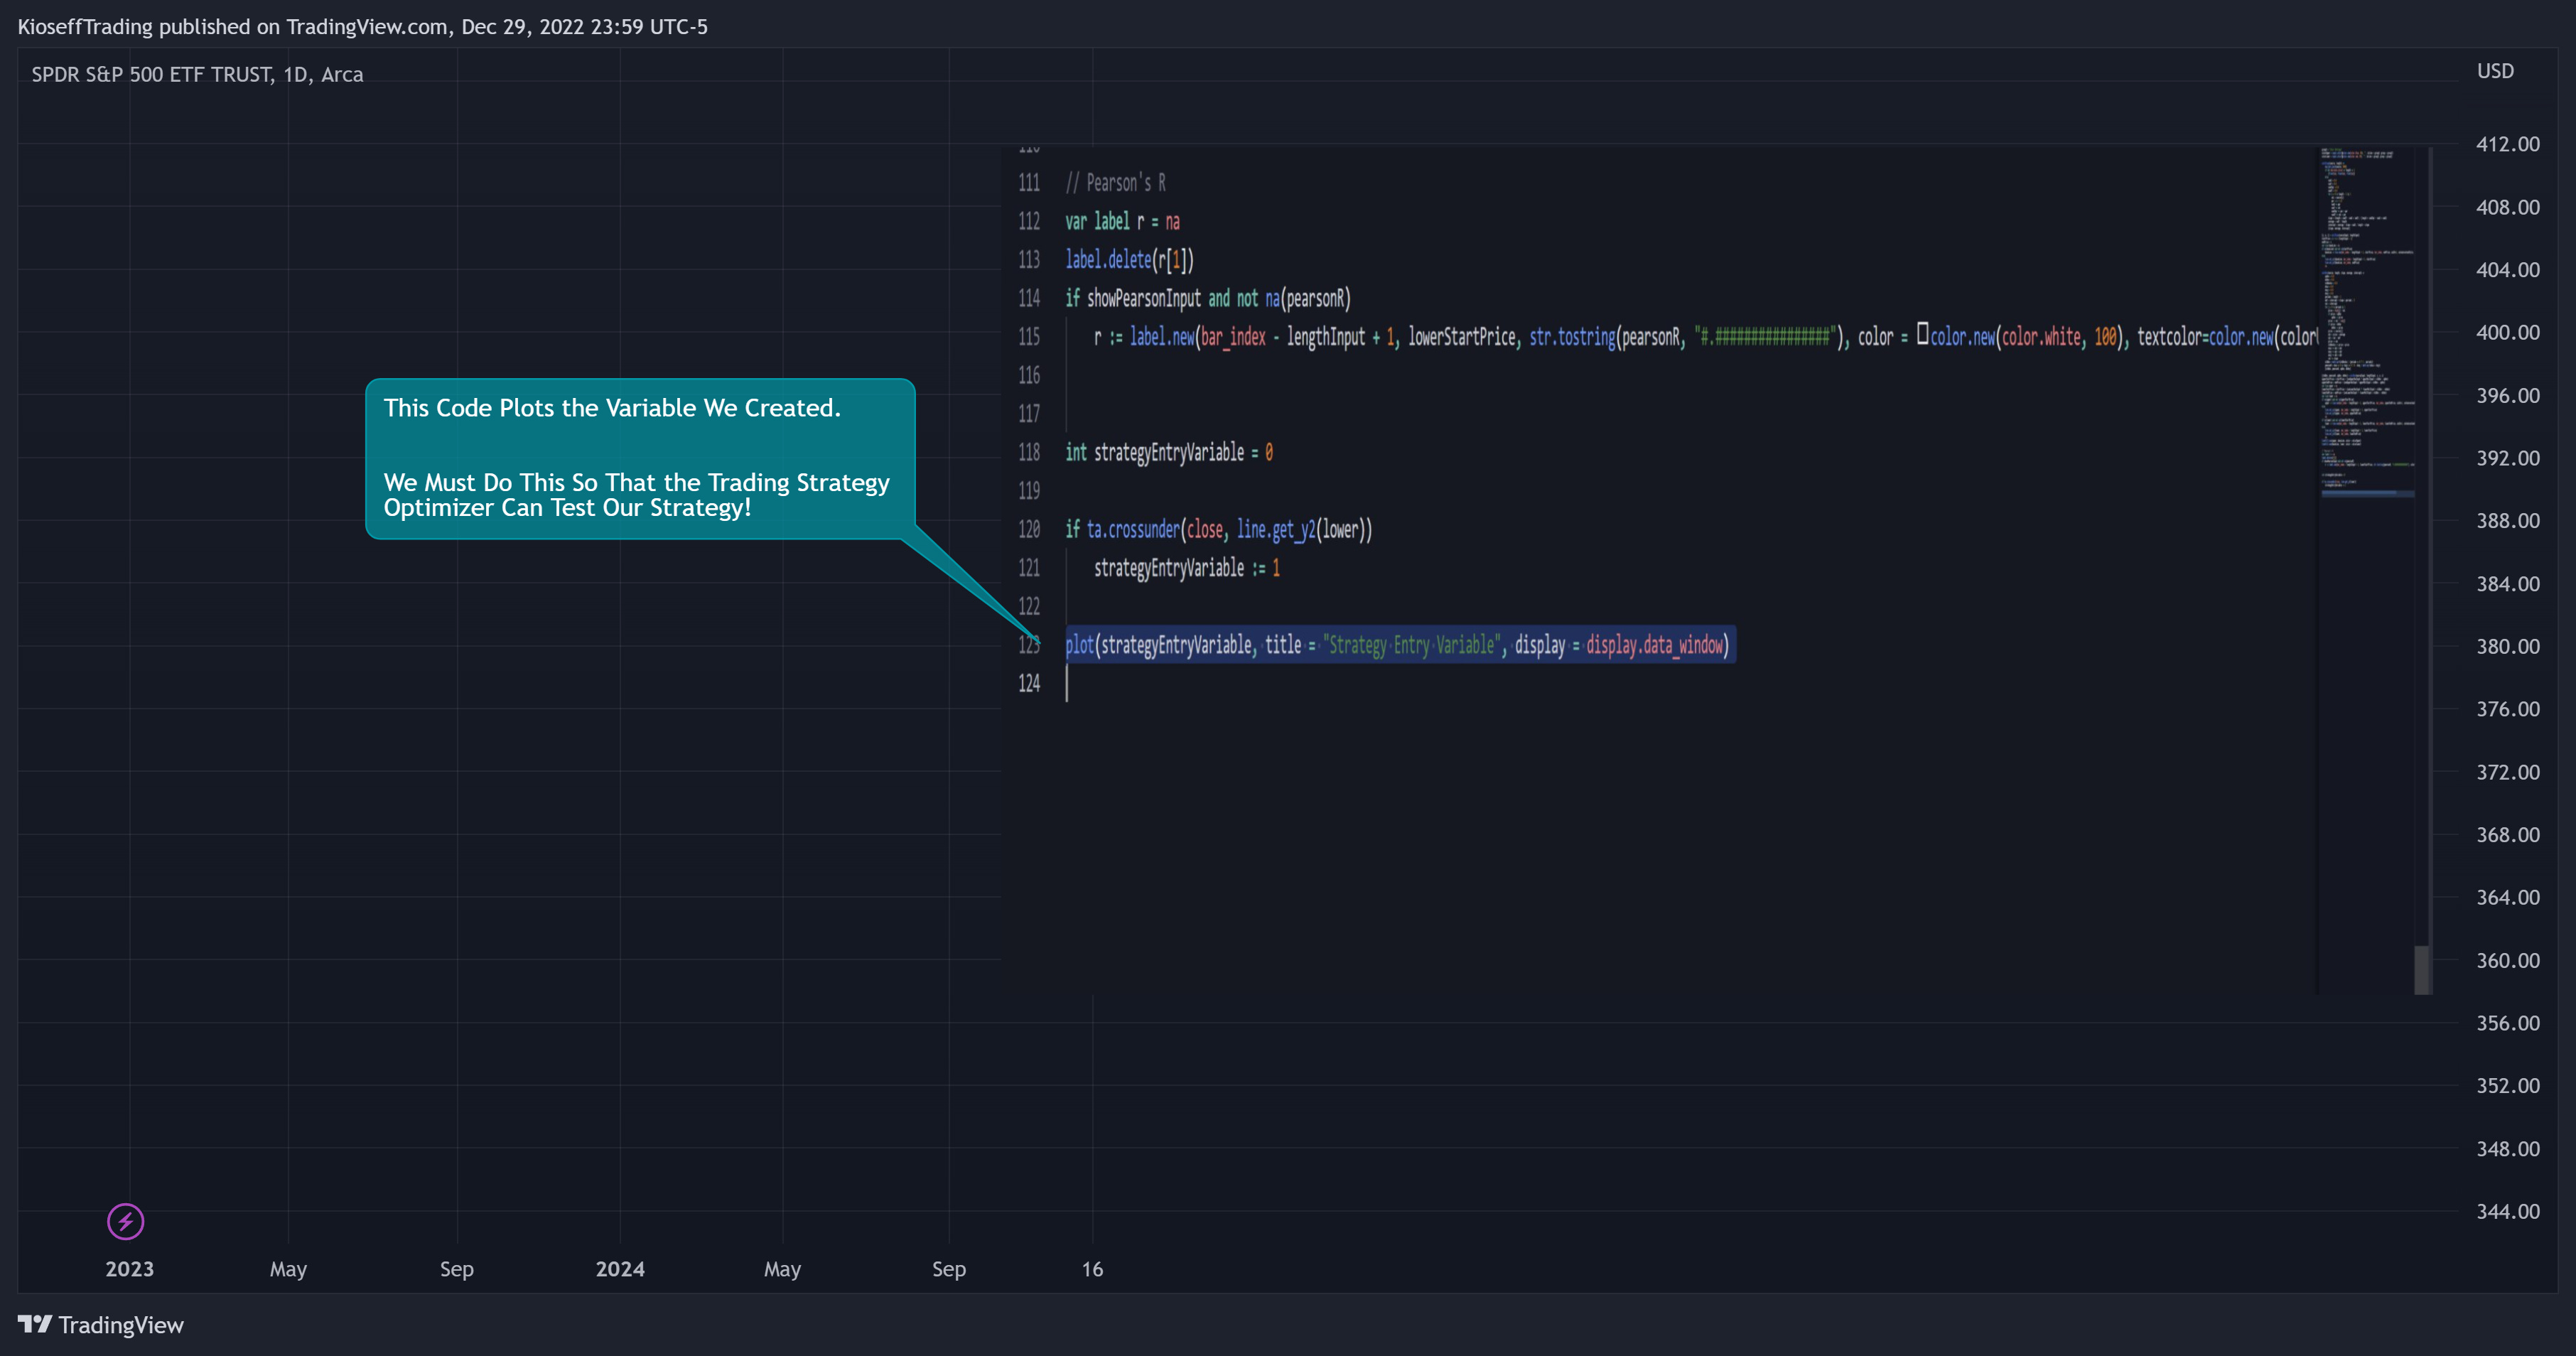
The image above shows code that plots the variable we created earlier!
4. Select the plotted variable in the settings for the Trading Strategy Optimizer
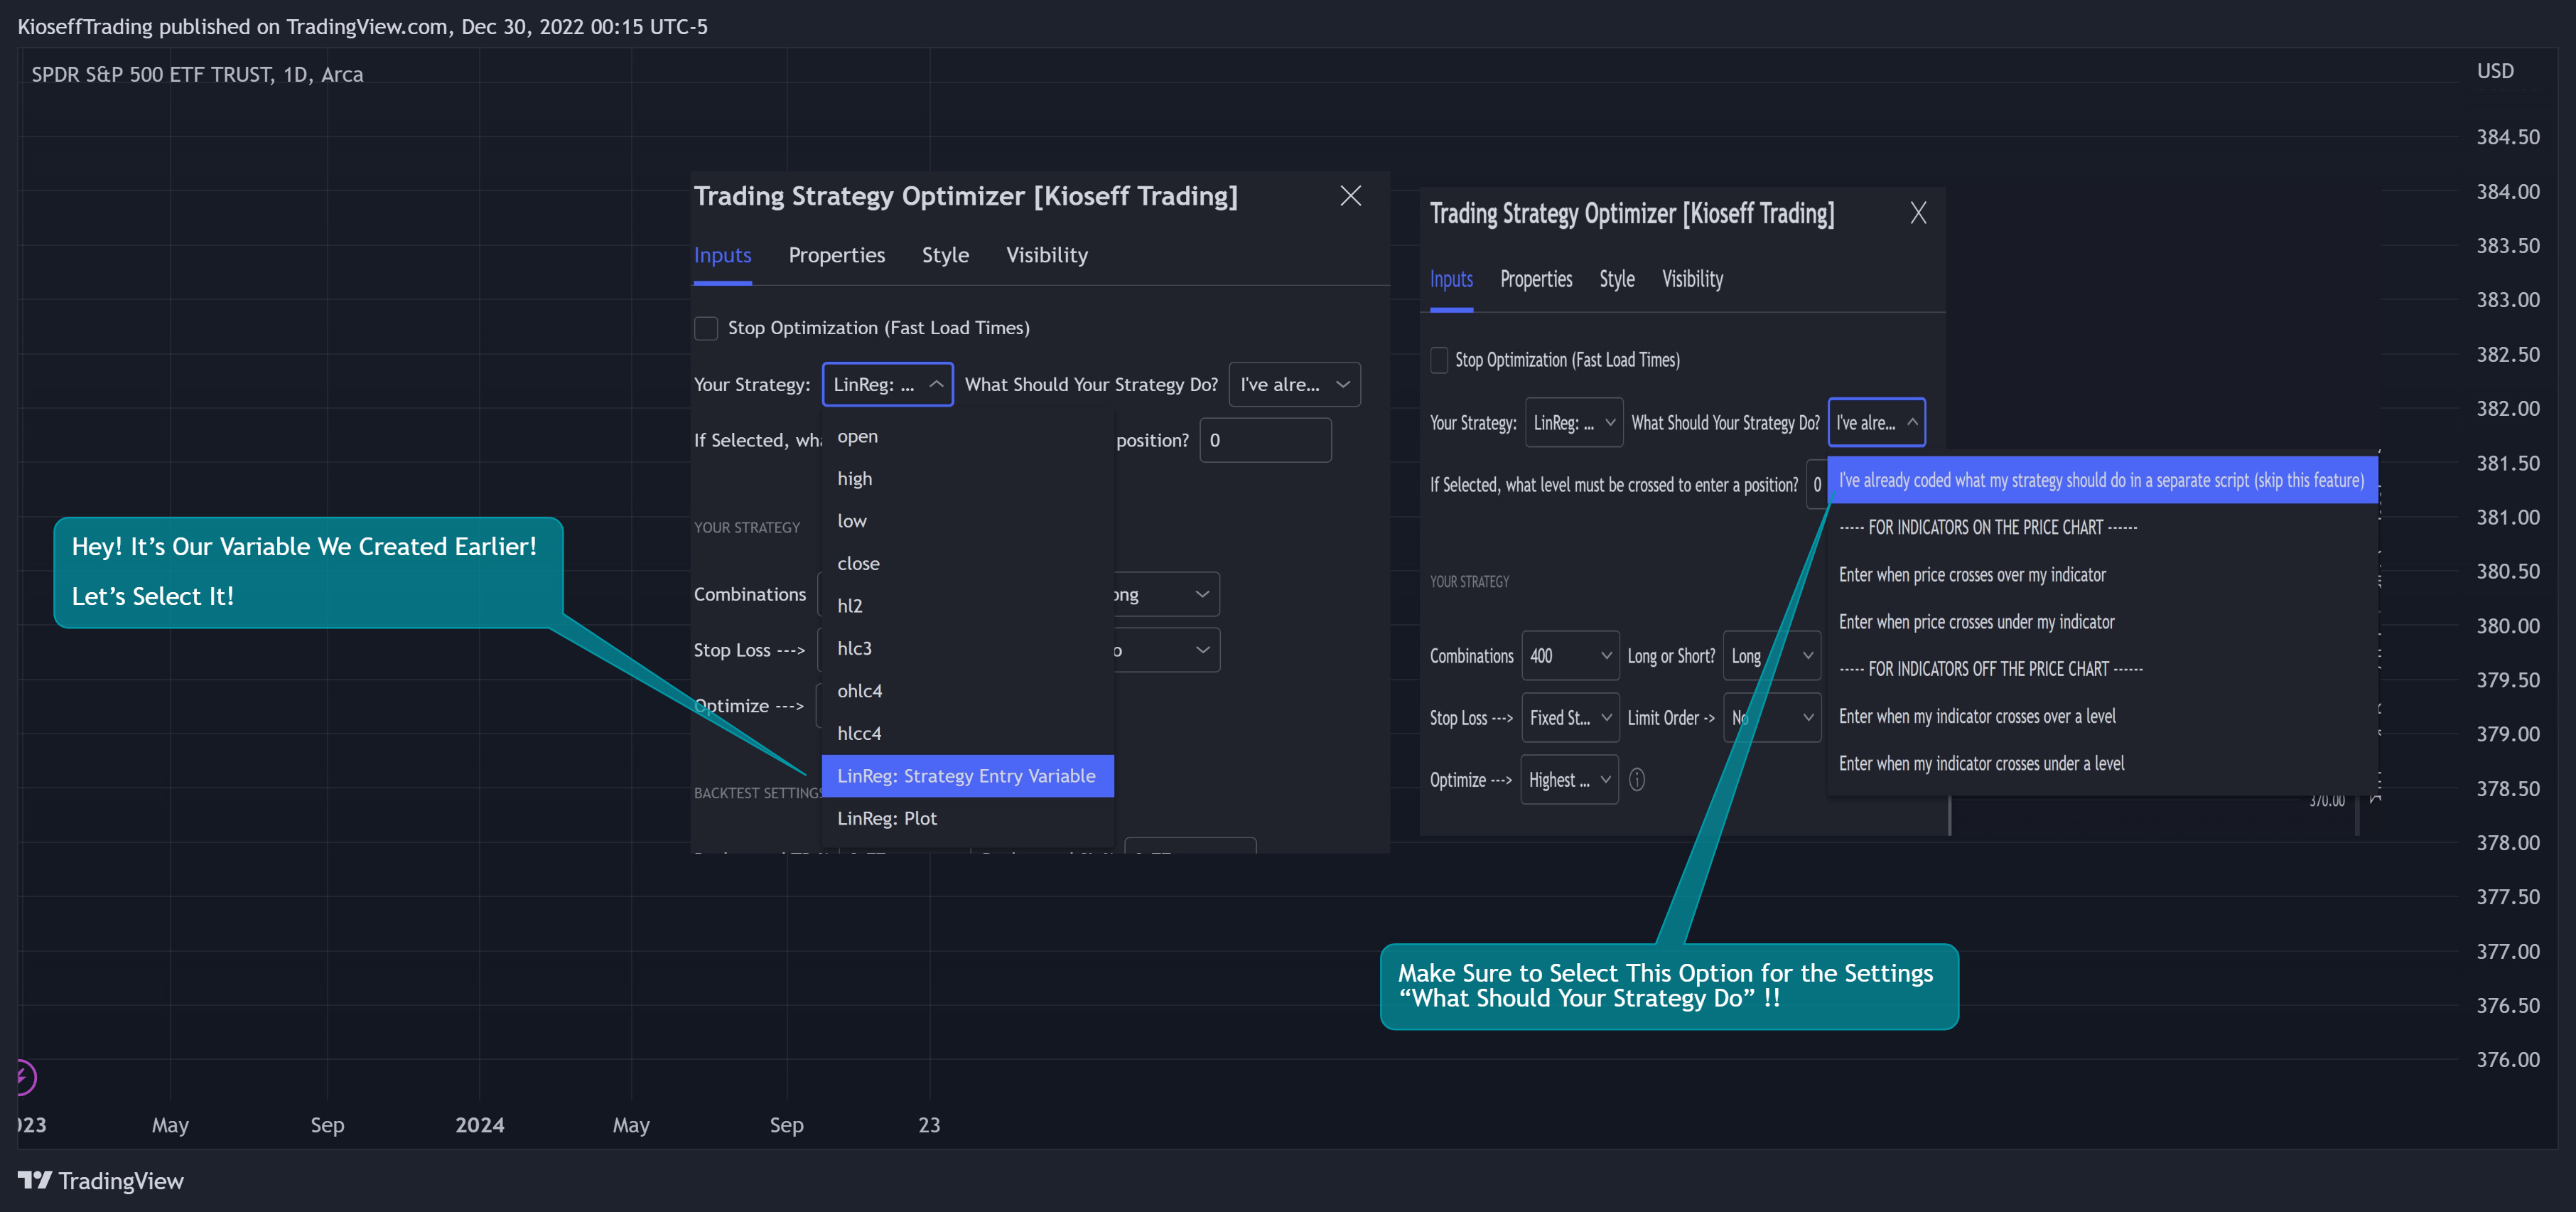
The image above shows me selecting the plotted variable we created in the Trading Strategy Optimizer settings. I also changed the "What Should Your Strategy Do?" setting!
5. Test Your Strategy
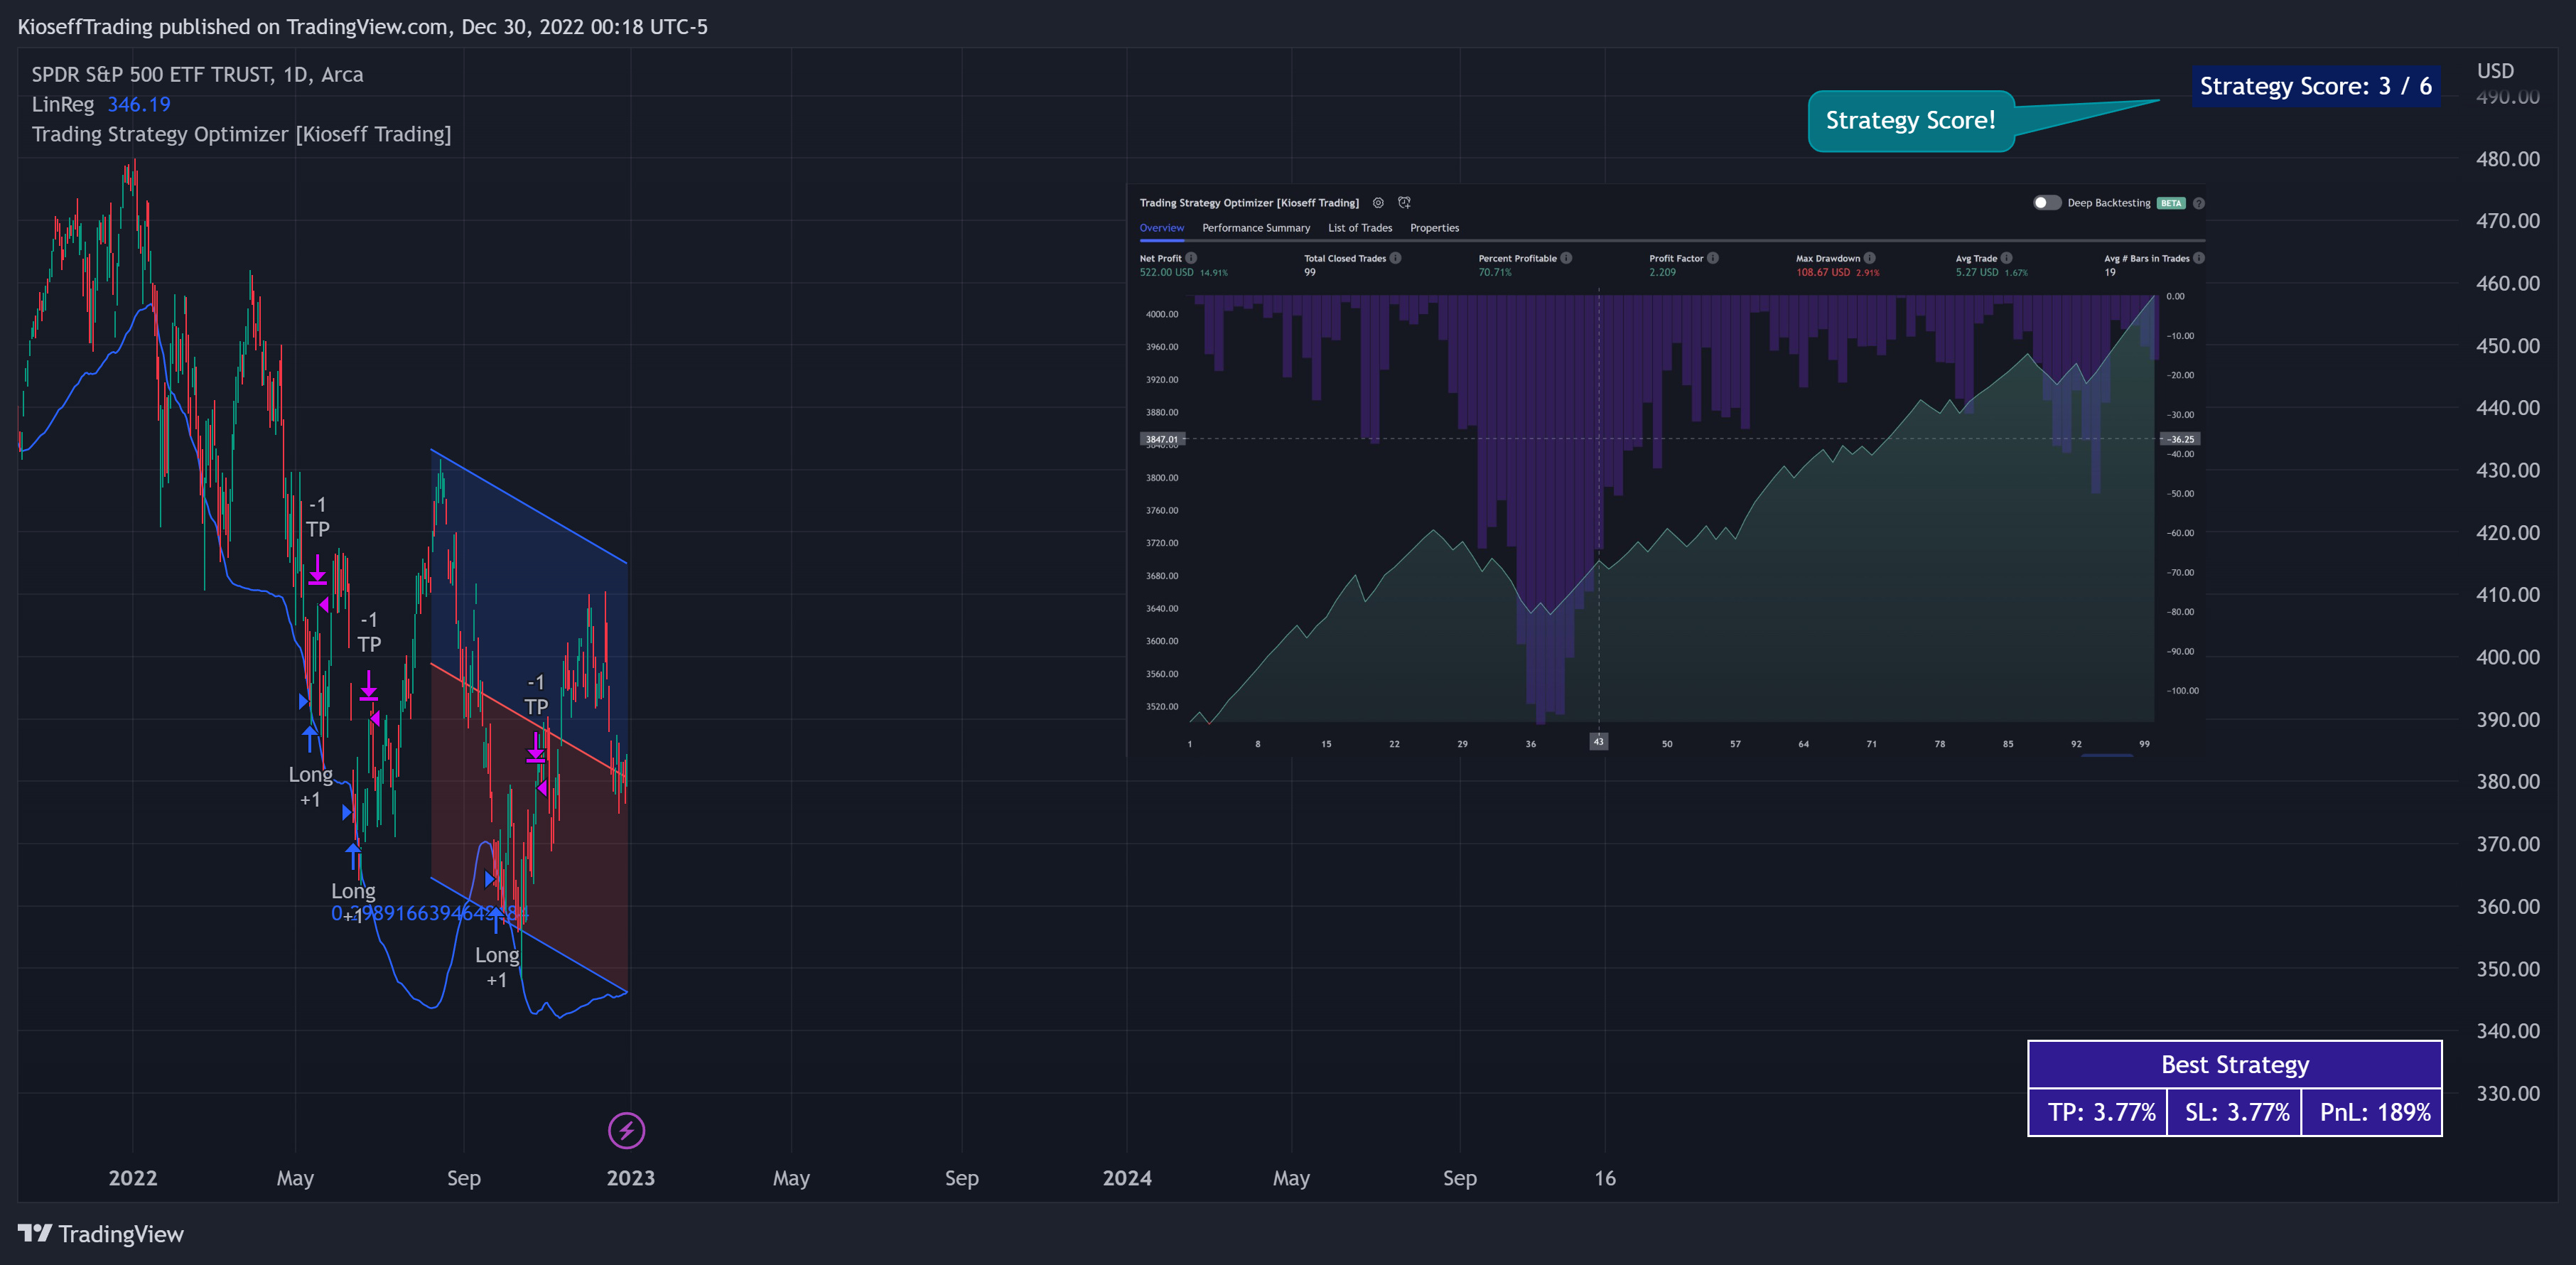
The image above shows the completion of the process! I tested 1000 variations of profit targets and stop losses for a linear regression channel strategy!
By following these instructions, you can build, test, and optimize almost any trading indicator or strategy!
So, just note that the Trading Strategy Optimizer considers a change in value of a plotted variable from "0" to "1" as an entry signal! So long as you follow this rule you should be able to test and optimize any conceivable, Pine Script compatible strategy!
Additional features
Built in to the optimizer are scoring metrics for your strategy and the "best-possible" TP 1, TP2, and TP3 levels!
The image above shows scoring metrics to s
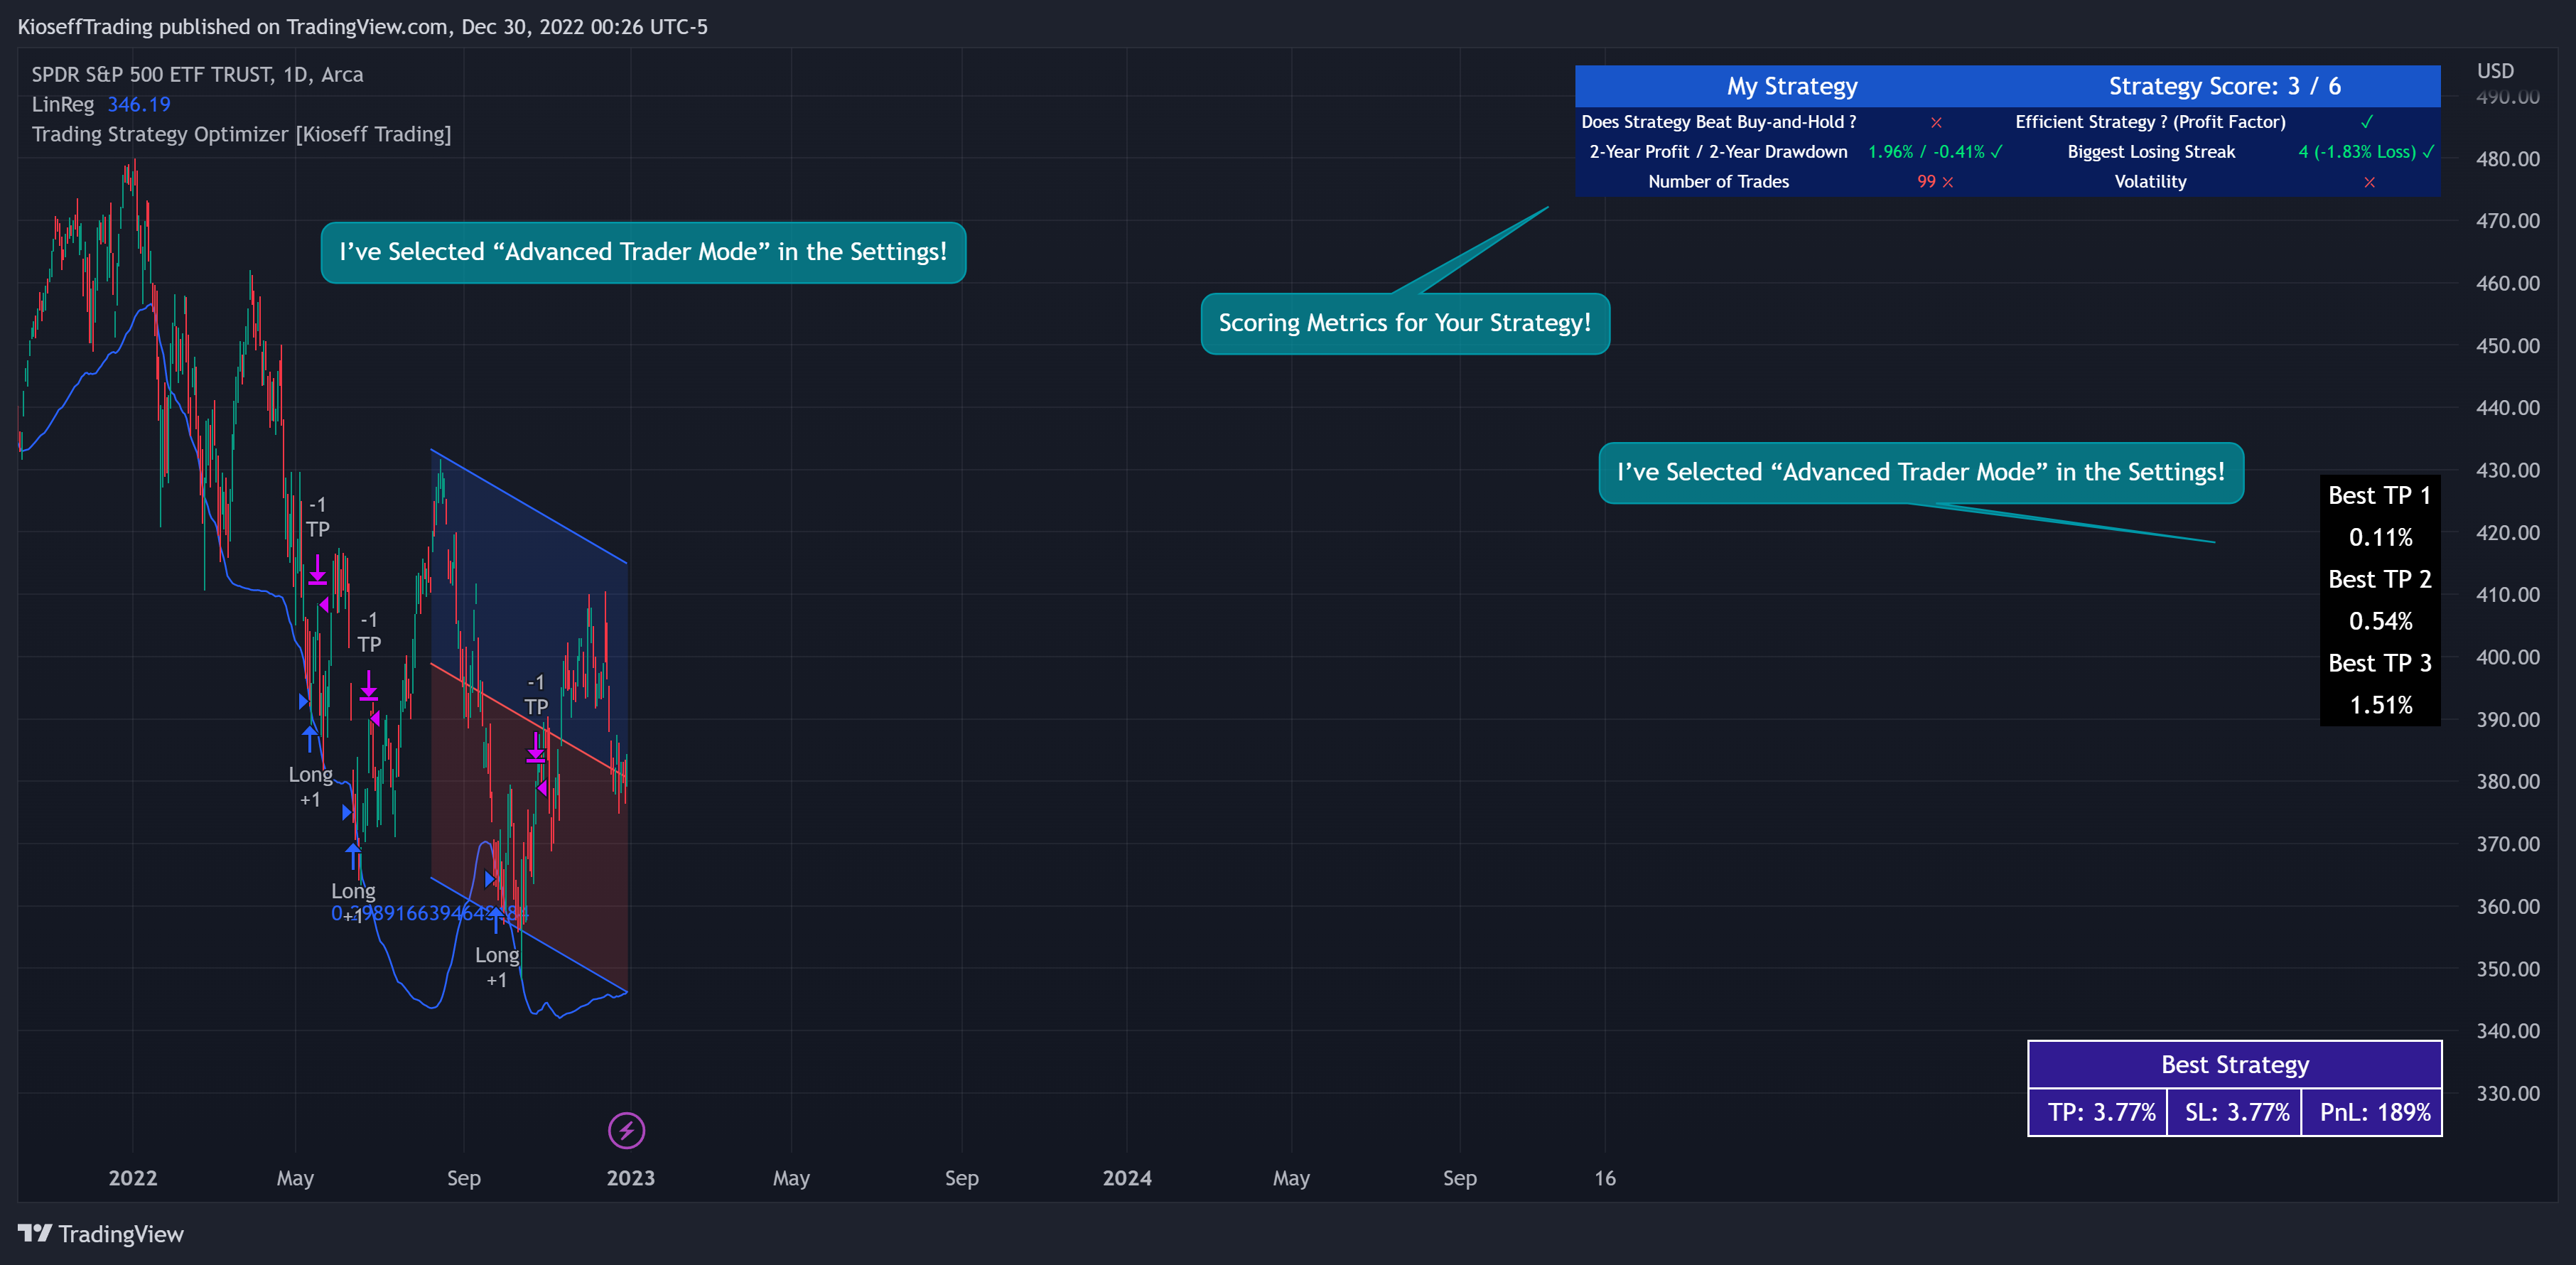
oft-check the utility of your strategy. Located to the right in the picture are the best TP 1, TP 2, and TP 3 levels!
Backtest Settings Shown
Initial Capital: The initial capital used for the shown backtests is $3,500 USD. Set the initial capital to replicate your true starting capital (: PnL for the strategies (listed in the table) are calculated using a starting capital of $10,000 USD.
Slippage: The slippage setting for the displayed backtest was set to 2 ticks.
Commission: Commission was adjusted to 0.04%.
Verify Price for Limit Orders was set to 2 ticks.
Optimization
Trading system optimization is immensely advantageous when executed with prudence.
Technical-oriented, mechanical trading systems work when a valid correlation is methodical to the extent that an objective, precisely-defined ruleset can consistently exploit it. If no such correlation exists, or a technical-oriented system is erroneously designed to exploit an illusory correlation (absent predictive utility), the trading system will fail.
Evaluate results practically and test parameters rigorously after discovery. Simply mining the best-performing parameters and immediately trading them is unlikely a winning strategy. Put as much effort into testing strong-performing parameters and building an accompanying system as you would any other trading strategy. Automated optimization involves curve fitting - it's the responsibility of the trader to validate a replicable sequence or correlation and the trading system that exploits it.